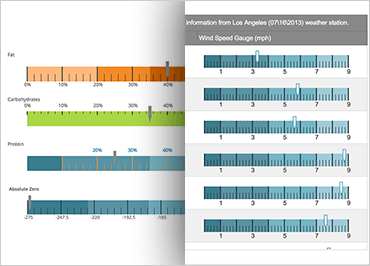
Ignite UIリニア ゲージ
Ignite UIのリニア ゲージコンポーネントは、特定のデータポイントが定義された範囲のどこにあるかを示す必要がある場合に最適なオプションです。このタイプのビジュアライゼーションの一般的な用途は、目標に向けた進行状況を示す場合や、データポイントが特定の範囲にある場合です。しかし、Ignite UIリニア ゲージはデータを表示する簡単な方法だけではありません。このコンポーネントは入力コンポーネントとしても機能し、ユーザーは連続体に沿って任意の場所に針を配置し、アプリケーションデータを更新できます。
サンプルを見るスケール設定
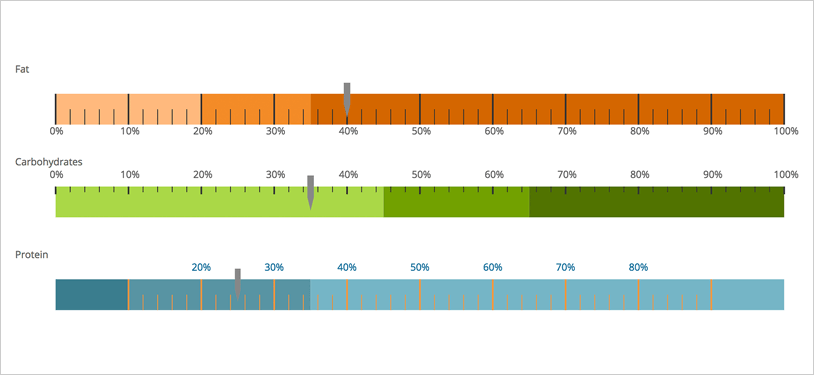
Ignite UI のリニア ゲージを使用すると、任意の範囲のカスタム スケールを作成できます。また、スケールに沿ってさまざまなゾーンを指定して、ゾーンを描写するための視覚的な手がかりを完備することもできます。この機能を使用すると、アプリケーションに必要な正確なスケールの外観を作成できます。
 サンプルを見る
グリッド統合
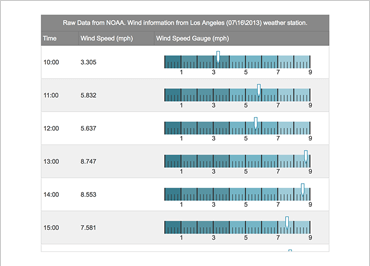
線形グリッドは、Webページでうまく機能するだけではありません。グリッドでもうまく機能します。Ignite UIを使用すると、線形グリッドを他のグリッドに簡単に追加して、ユーザーインターフェイスをさらに直感的にすることができます。
サンプルを見るニードルドラッグ
リニア ゲージコントロールは、優れたデータ視覚化ツールです。しかし、それはデータを伝えるためだけのものではありません。数行のコードで、リニア ゲージコントロールも優れた入力コンポーネントになります。
 サンプルを見る