Ignite UIブレットグラフ
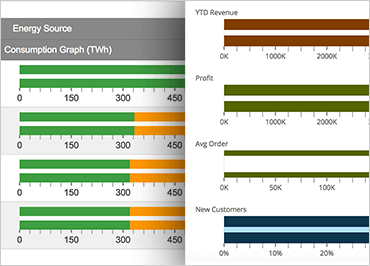
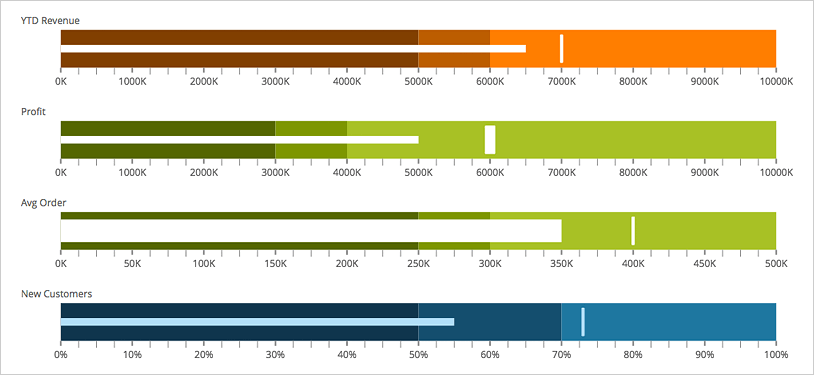
Ignite UI Bullet Graph コントロールは、連続体に沿って値を表示します。この視覚化により、目標に対する正または負の進行状況を表示できます。ブレットグラフは、アプリケーション内のタスクのKPIやステータスバーなど、目標に向けた進行状況を示すのに最適です。Ignite UIのブレットグラフは、カスタムスケールとティックマークの設定、カスタム範囲設定、アニメーション、垂直表示など、最も完全なカスタマイズオプションを提供します。
サンプルを見るパフォーマンスバーの設定
Ignite UI のブレット グラフ コントロールは、パフォーマンス データを視覚化する独自の方法を提供します。いくつかの簡単な設定で、グラフにターゲットを指定して、ユーザーがそのターゲットに対する進行状況を確認できるようにすることができます。
 サンプルを見る
グリッド統合
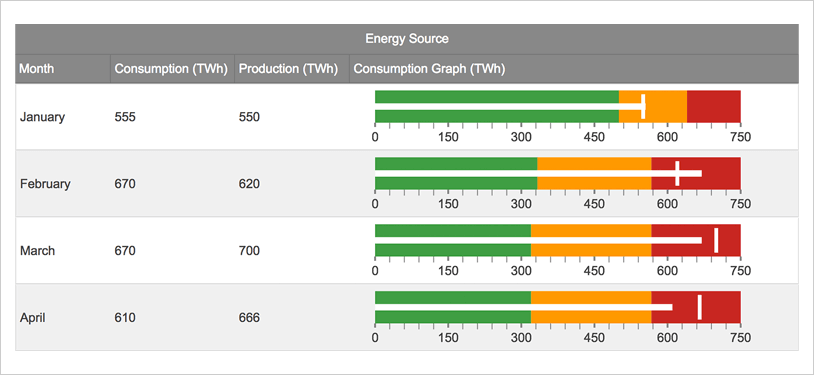
Ignite UI の Bullet Graph コントロールは、それ自体がデータを視覚化するための非常にユーザーフレンドリーな方法です。Ignite UI のグリッド コントロールと組み合わせると、直感的で独創的な方法でデータを表示する柔軟性と機会がさらに向上します。
 サンプルを見る