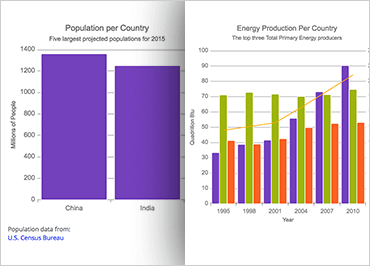
Ignite UIデータ チャート
Ignite UI for JavaScript のデータ チャートは、高いパフォーマンスと柔軟性を実現するために構築された HTML5 グラフ コンポーネントです。データ チャートコントロールは、グラフ作成に精通し、グラフ作成コンポーネントに最も柔軟性を求める開発者向けです。多くの優れた機能が含まれており、75種類以上のチャートタイプを提供しています。これらのグラフは、データセット内のデータ量に関係なく、非常に高速にレンダリングされます。
JavaScriptデータ チャートのIgnite UIは、高度なカスタマイズと柔軟性を提供します。より簡単な設定プロセスを備えたシンプルなチャートコンポーネントをお探しの場合は、Ignite UIカテゴリ チャートを参照してください。
サンプルを見るリアルタイムデータ
データは常に変化しています。データのスナップショットが必要な場合もあれば、そのデータをライブで移動しているのを確認する必要があります。Ignite UI for JavaScript のデータ チャートコンポーネントは、リアルタイムのデータソースにバインドし、わかりやすいビジュアルでユーザーに一定の情報ストリームを提供します。
 サンプルを見る
大容量データ
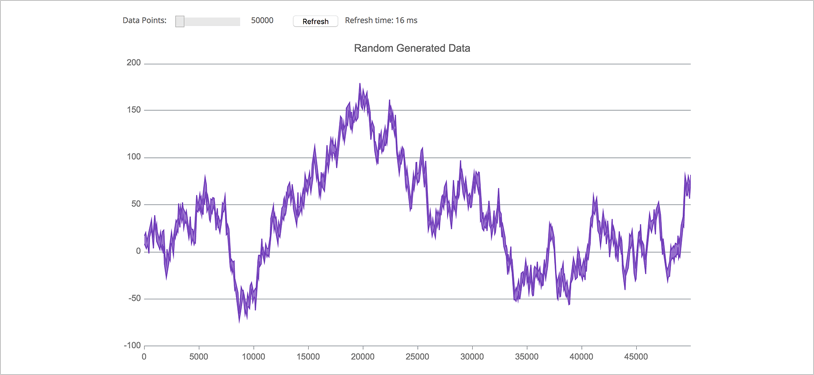
企業のデータは、最も貴重な資産の 1 つです。このことを認識した企業は、膨大な量のデータを活用する方法を模索しています。Ignite UI for JavaScript のデータ チャートコンポーネントは、これらの大量のデータを簡単に処理し、データをすばやくレンダリングして優れた視覚化にすることができます。
 サンプルを見る
アニメーション
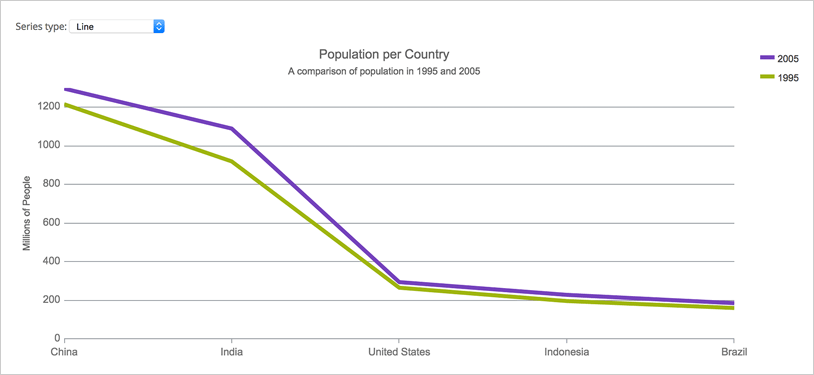
グラフは、ビジネス データを操作するための優れたツールです。Ignite UI for JavaScript には、アニメーションなど、グラフの「すべてのビジネス」の側面と、ユーザーの関心を維持する優れたユーザー インターフェイスをまとめた多くの機能があります。
 サンプルを見る
複合チャート
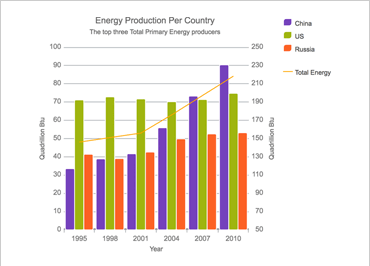
データが複雑すぎて、標準の 2 次元グラフで簡単に表示できない場合があります。このような状況では、Ignite UI for JavaScript のデータ チャートコンポーネントを使用して複合グラフを作成します。2 つの Y 軸を持つグラフを作成すると、2 つの異なるデータ セットが相互にどのように関連しているかなど、より複雑な視覚化を表示できます。
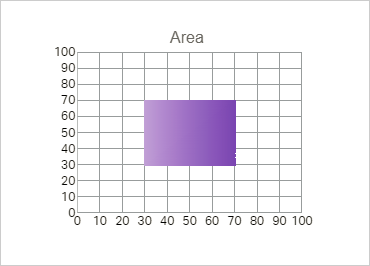
散布エリアシリーズ
Scatter Area Series は、X 座標と Y 座標の三角測量と、サーフェスの各ピクセルに割り当てられた数値に基づいて、デカルト コンテキストで色付きのサーフェスを描画します。このシリーズを使用して、磁場の強さ、2次元平面に投影または平坦化された3次元形状、データ内の3つの数値列間の相関関係などの科学データをプロットできます。
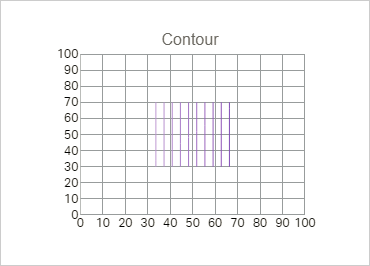
散乱輪郭線シリーズ
Scatter Contour Series は、Scatter Area Series と同じデータをプロットでき、補間されたサーフェス領域の代わりに等高線を使用してデータを視覚化できます。

散乱ポリラインシリーズ
散布ポリライン シリーズは、X/Y 点のコレクションを使用して定義されたカスタム形状のアウトラインをプロットできます。このシリーズでは、データポイント間の複数の接続を表示して、降格を示したり、ネットワークのビューを構築したりできます。
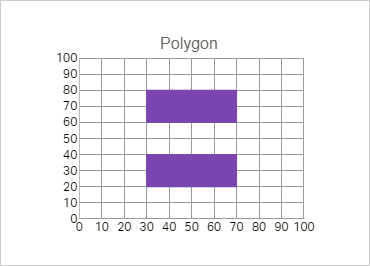
ポリゴン シリーズを散布
散布ポリゴン シリーズは、X/Y ポイントのコレクションのコレクションを使用して定義されたカスタム塗りつぶし形状をプロットできます。このシリーズを使用して、チャートのプロット エリア内の領域を強調表示できます。
日付/時刻軸
日付/時刻軸は、ブレーク、動的インターバル、および動的ラベリングをサポートする改良された時間軸です。Breaks コレクションを使用すると、開発者は、週末やその他の重要でない期間など、範囲内の日付を省略するように X 軸を構成できます。Intervals コレクションを使用すると、軸の表示範囲 (年が表示される各月のラベルなど) に基づいて、条件付きラベル間隔を簡単に指定できます。ラベル形式は、表示範囲に応じて構成することもできます。


最終値の注釈
データ ソース内の最後のデータ ポイントの値が表示されます。データソースごとに 1 つの色付きのボックスを Y 軸ラベル上にレンダリングします。

十字線の注釈
カーソル位置にデータ ポイント値を表示し、これらの値を X 軸と Y 軸のラベル上の色付きのボックスにレンダリングします。
コールアウト レイヤー
重要なデータポイントに注釈を付けたり、ロジックに基づいてコールアウトボックスの値をカスタマイズしたりします(つまり、データソースの最大値を計算します)。

