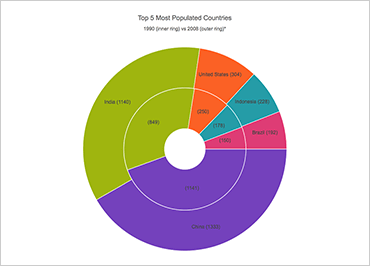
Ignite UIドーナツ チャート
Ignite UI for JavaScript のドーナツ チャートは円チャートと似ていますが、コンテンツに関する追加情報の中央が空です。Ignite UI for JavaScriptのドーナツグラフを使用すると、中央のスペースに別のグラフを埋め込むことができます。これは、関連する 2 つ (またはそれ以上) のデータ系列を表示し、それらを視覚的に比較する場合に便利です。Ignite UI for JavaScript を使用すると、ドーナツ グラフに内部グラフを簡単に埋め込むことができます。ドーナツ チャートコンポーネントには、カスタマイズされた凡例、ラベル、ツールヒントなど、外観をカスタマイズするのに役立ついくつかの機能が用意されています。
サンプルを見る