Ignite UI地理地図
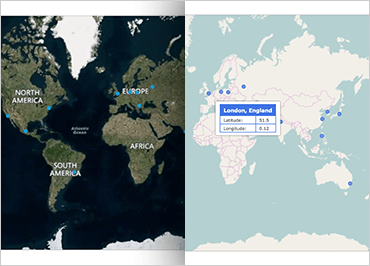
Ignite UI Map コンポーネントは、地理データを視覚化する機能をアプリケーションにもたらします。多くの地理的な位置で構成されるデータセットを、マーカー、線、ポリゴン、さらにはインタラクティブなビットマップの形でレンダリングできます。地図コンポーネントには、複数の地図レイヤーを地理データ (Bing や Open Street などのプロバイダーからのデータを含む) でオーバーレイする機能が含まれており、特定の地理的な場所をマークし、カスタム マーカーと色を使用して情報を表示することができます。
サンプルを見る
Ignite UIズームバー
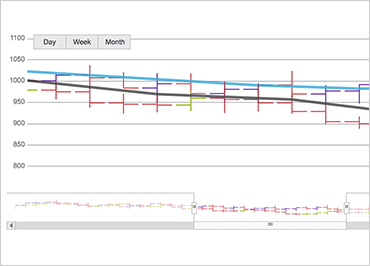
Ignite UI のデータ視覚化は、大量のデータをサポートします。しかし、ユーザーはそのデータのごく一部に注目したいだけの場合もあります。Ignite UI の Zoombar コンポーネントを使用すると、ユーザーがデータをズームインおよびパンできるようにすることができます。また、Ignite UI のすべてのデータ視覚化ツールと同様に、Zoombar は大量のデータでも高速でスムーズです。
サンプルを見る