

必要なチャート
パフォーマンスとエンタープライズのニーズを念頭に置いて構築されたIgnite UI for JavaScript グラフは、75 を超える視覚化オプションを使用して大量のデータをレンダリングします。
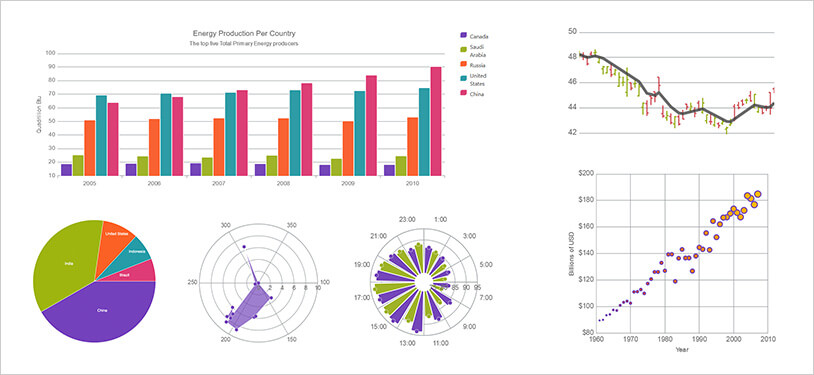
- 棒グラフ、縦棒グラフ、積み上げグラフは、1 つ以上のデータ系列のデータポイントを比較します。
- Scatter と Bubble は、一連の実験データの 2 次元または 3 次元の値を表示します。
- ライン、エリア、スプラインにより、定量的なデータをグラフィカルに表示
- 連続して導入された正または負の値の集合的な影響を理解するためのウォーターフォール
- ポイントは、個々のプロットされたポイントマーカーを使用して分類されたデータを視覚化します
- ローソク足とOHLCにより、証券、デリバティブ、または通貨の価格変動を視覚化
- 極点散乱、折れ線、またはスプラインシリーズのチャートは、接続されていない離散点を表示し、特定の領域の点の「密度」を評価するためのものです
- 放射状の線、縦棒、または円グラフグラフを使用して、1つのオブジェクトの複数の側面を定量的に比較します
インタラクティブチャート
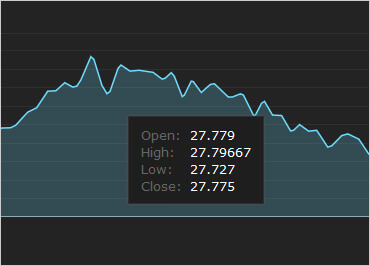
数回クリックするだけで、ホバーインタラクション、シリーズの強調表示、ツールチップ、十字線などの機能をユーザーに提供するインタラクティブチャートを使用して、金融および経済シナリオを最大限に活用できます。
レポートのシリーズ全体またはシリーズ内の個々のアイテムを強調表示したり、グラフの特定の部分に焦点を合わせたり、ビジネス ニーズに最も適したグラフをカスタマイズしたりできます。
Ignite UI のズームバーで詳細な分析を作成
ズームバーは、チャートとタイムラインの機能をさらに強化し、他のコントロールに接続することもできます。これにより、ユーザーは、たとえば、財務分析や株式追跡レポートなどで現在重要な詳細に集中し、データを明確に表示して、より迅速で十分な情報に基づいた意思決定を行うことができます。
サンプルを見る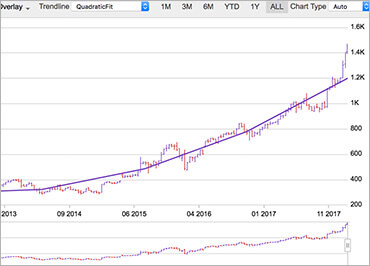
トレンドライン – 財務データのトレンドを自動的に計算します
Ignite UI for JavaScriptのトレンドラインを使用すると、ユーザーはデータの傾向を評価し、過去、未来、または未知の値を精神的に推定できます。金融シナリオで非常に役立つトレンドラインを使用すると、トレンドの方向性ラインを生成するためのいくつかの式から選択できます。
サンプルを見る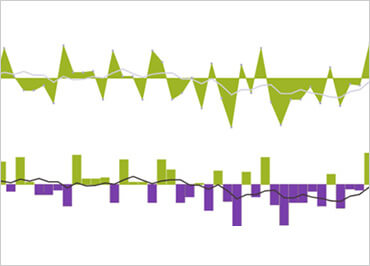
スパークライン
Ignite UI for JavaScript スパークライン チャート コンポーネントは、データ量が多く、デザインがシンプルなグラフィックであり、エンド ユーザーはデータの傾向、バリエーション、パターンを明確でコンパクトな表現で見つけることができます。
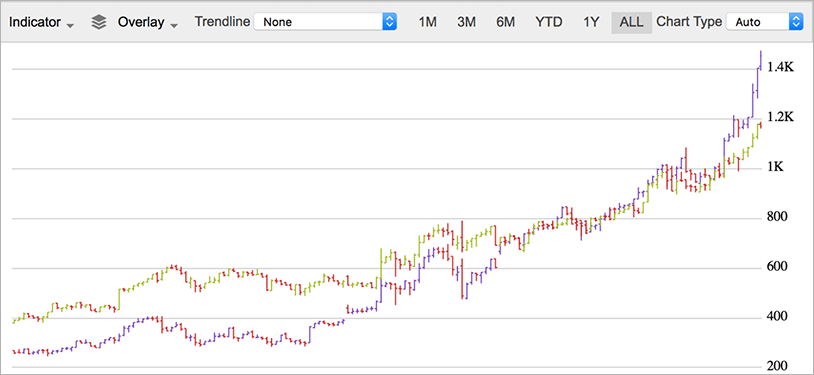
サンプルを見るファイナンシャル チャート
この軽量チャートを使用して財務データを簡単に構成し、高性能で大量の金融サービスおよび資本市場データアプリケーションを構築します。データをバインドするだけで、チャートが他のすべてを処理します。
 サンプルを見る
アニメーション
Infragistics Motion Framework を使用すると、開発者はIgnite UIチャート コントロールを使用して、データの視覚的な魅力を高め、データの背後にある傾向やその他の意味を暗示することができます。エンドユーザーが完全にカスタマイズ可能で、没入型で、アニメーション化されたユーザーエクスペリエンスを体験できる方法で、データのストーリーを伝えます。エンドユーザーは、時間を段階的に移動して、遷移ごとに変化するデータポイント間の関係を確認できます。
ルックアンドフィールのカスタマイズ
データ視覚化コントロールのグラフ軸、凡例、ツールチップ、タイトルを、ビジネスと開発のニーズに最適な方法でカスタマイズします。
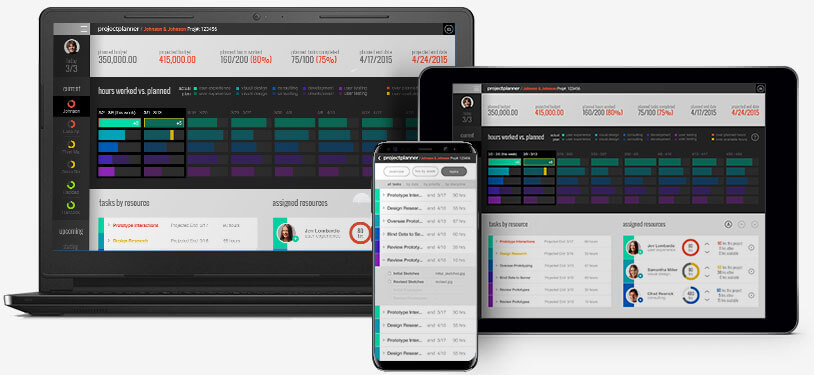
モバイルおよびクロスブラウザ対応
モバイルとデスクトップの両方で同じエクスペリエンスを提供し、すべてのブラウザで一貫した動作を実現します。
今すぐ始めましょう。標準サポートを含む30 日間の無料試用版をダウンロードしてください。
トライアル版をダウンロード