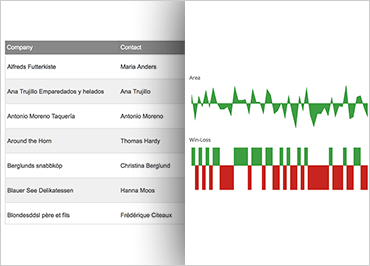
Ignite UIスパークライン
Ignite UI for JavaScript の Sparkline コントロールは、データ量が多く、デザインがシンプルな視覚化であり、ユーザーはデータの傾向、バリエーション、パターンを明確でコンパクトな表現で見つけることができます。JavaScript データビジュアライゼーションのすべてのIgnite UIと同様に、スパークライン コンポーネントには、マーカー、ツールチップ、正規範囲とトレンド ラインを追加する機能など、多くのカスタマイズ機能があります。
サンプルを見るチャートの種類
基本的な折れ線グラフに加えて、Ignite UI for JavaScript の Sparkline コンポーネントには、データを表示するための他のモデルがいくつか用意されています。どちらを選択しても、大量のデータでもチャートは迅速かつスムーズにレンダリングされます。
 サンプルを見る
グリッド内のスパークライン
Ignite UI for JavaScript の Sparkline コンポーネントは、それ自体がアプリケーション データを表示するための便利で柔軟な方法です。グリッド コンポーネントと組み合わせると、直感的で独創的な方法でデータをユーザーに提示する機会がさらに増えます。
 サンプルを見る