
Ignite UIスプレッドシート
スプレッドシート コンポーネントは、強力でありながら使い慣れたデータ管理方法をユーザーに提供します。スプレッドシート コンポーネントは、Infragistics JavaScript Excel ライブラリでサポートされており、ローカルまたはサービスから Microsoft Excel ファイルとの間でデータをインポートおよびエクスポートできます。スプレッドシートは、ワークブック、ワークシート、セル、数式など、すべての基本的なスプレッドシート機能をサポートしています。
サンプルを見る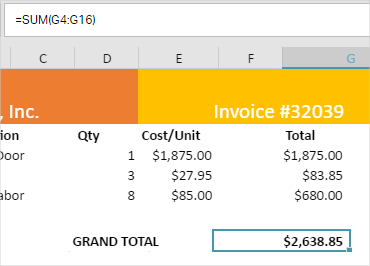
フォーミュラバー
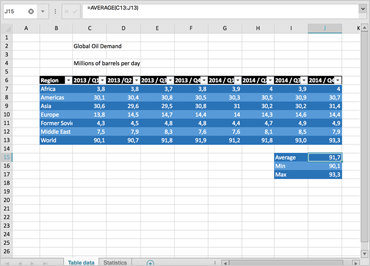
スプレッドシートの最も強力な機能は、スプレッドシートのデータに基づいて数式を作成する機能です。スプレッドシートコンポーネントには、ユーザーが数式定義を表示できる数式バーが含まれています。スプレッドシートコンポーネントはカスタム数式をサポートし、GEOMEAN や HARMEAN などのより複雑な数式に加えて、SUM、MEAN、MEDIAN などの単純な数式を含む多数の組み込み関数を提供します。フォーミュラバーはサイズ変更も可能であるため、長いフォーミュラや複雑なフォーミュラを見やすくなっています。
設定可能なビュー
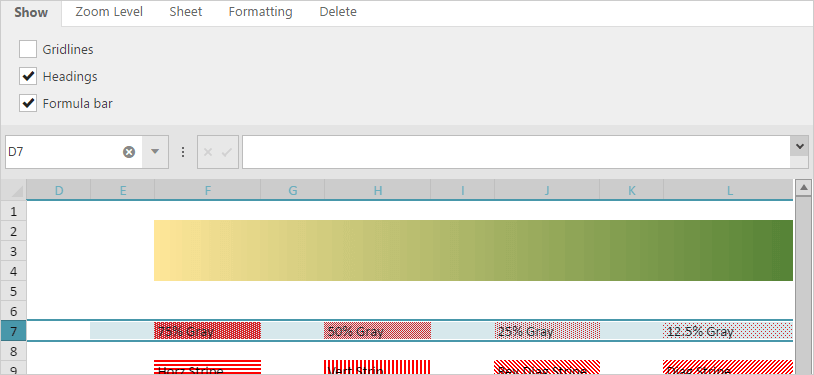
スプレッドシートコンポーネントには、ユーザーが提示されたデータを操作および消費する方法を管理するための多くのオプションが用意されています。グリッド線、見出し、および数式バーをプログラムで非表示にできます。スプレッドシートは、ズームとテキストの書式設定 (太字、斜体、下線) もサポートしています。これらの機能はリアルタイムで動作するため、ユーザーはこれらの設定をその場で変更できます。ユーザーは、スプレッドシートをスクロール可能なペインに分割し、最初の列または行を固定することもできます。
 サンプルを見る
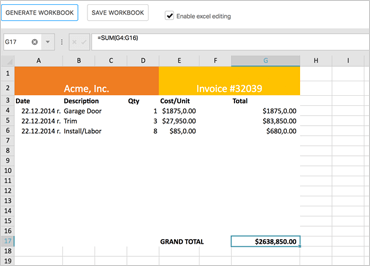
データをExcelにインポートして保存する
スプレッドシート コンポーネントは、Infragistics JavaScript Excel ライブラリの機能を活用して、ユーザーが Microsoft Excel ファイルとの間でデータをインポートおよびエクスポートできるようにします。ユーザーは Excel ファイルからデータをインポートすることも、プログラムによってワークブックのデータオブジェクトを生成してスプレッドシートに表示することもできます。同様に、ユーザーは Web ベースのアプリからデータをエクスポートし、ローカル ファイルに保存するか、リモート コンピューターにストリームできます。スプレッドシート コンポーネントは、すべての Excel 数式と、ブックやワークシートなどの Excel 構造機能をサポートします。Excelエンジンは100以上の関数をサポートしています。
サンプルを見る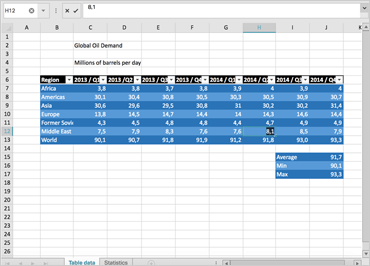
Excelの編集とフォーマット
igSpreadsheet は、既存の Excel フレームワークを基盤として構築されており、強力な Excel ドキュメント機能にインタラクティブなコントロールを提供します。編集機能とセルの書式設定機能には、条件付き書式、並べ替え、フィルタリングなどがあり、Excel をインストールしなくても実行できます。
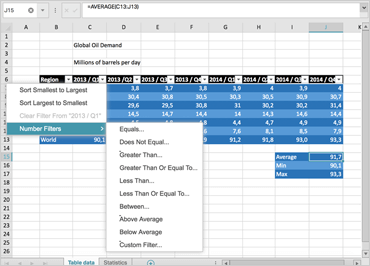
ワークシートの並べ替えとフィルタリング
テーブル レベルとワークシート レベルの並べ替えとフィルター処理機能を使用すると、ワークシート内またはテーブル外のテキスト、数値、日付、または色の書式設定で領域を定義し、並べ替えたり、フィルター処理したりできます。フィルターのリストから選択するか、特定のフィルターを作成してビューをカスタマイズします。「カスタムソート」ダイアログ、「トップ 10 フィルタ」ダイアログ、および「セルのフォーマット」ダイアログでは、2 次ソート、上位 10 件 (または下位 10 件) のレコードによるソート、およびスプレッドシートのセル内のデータの表示方法を調整できます。また、フィルターのリストから選択したり、カスタマイズしたものを作成したりすることもできます。
テーブルの作成と管理
改善された機能では、テーブル全体のコピーと貼り付け、テーブルの展開と編集、行間の移動、一般的な数式の選択、コンテキスト メニューを使用したテーブルへの行、列、およびデータの追加を行うことができます。
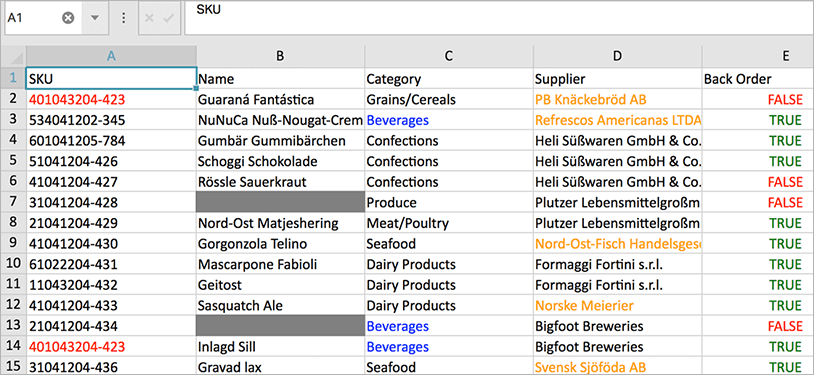
条件付き書式
データ バーのプリセット、2 色または 3 色のグラデーションによるカラー スケール、アイコンなど、Microsoft Excel で使用できるすべての条件付き書式機能をレンダリングします。
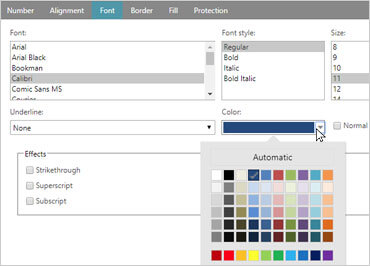
セルの書式ダイアログ
セルを右クリックして、[セルの書式設定] ダイアログ ボックスを使用してセル データを書式設定します。数値の表示、配置、フォント、網かけ、境界線、ワークシートデータの保護を変更します。