
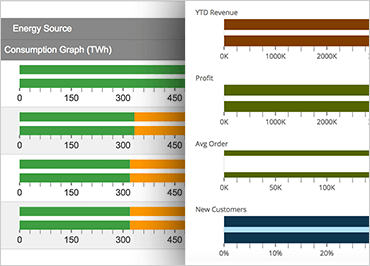
Ignite UIブレットグラフ
Ignite UI Bullet Graph コントロールは、連続体に沿って値を表示します。この視覚化により、目標に対する正または負の進行状況を表示できます。ブレットグラフは、アプリケーション内のタスクのKPIやステータスバーなど、目標に向けた進行状況を示すのに最適です。Ignite UIのブレットグラフは、カスタムスケールとティックマークの設定、カスタム範囲設定、アニメーション、垂直表示など、最も完全なカスタマイズオプションを提供します。
サンプルを見る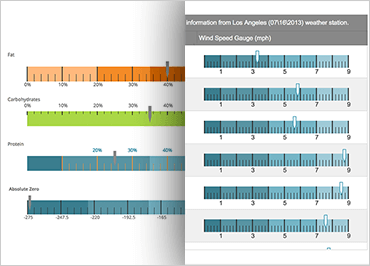
Ignite UIリニア ゲージ
Ignite UIのリニア ゲージコンポーネントは、特定のデータポイントが定義された範囲のどこにあるかを示す必要がある場合に最適なオプションです。このタイプのビジュアライゼーションの一般的な用途には、目標に向けた進行状況を示すことや、データポイントが特定の範囲にあるかどうかを示すことなどがあります。しかし、Ignite UIリニア ゲージはデータを表示する簡単な方法だけではありません。このコンポーネントは入力コンポーネントとしても機能し、ユーザーは連続体に沿って任意の場所に針を配置し、アプリケーションデータを更新できます。
サンプルを見る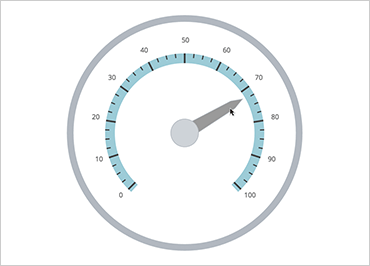
Ignite UIラジアル ゲージ
このIgnite UIラジアル ゲージは、連続体に沿ってデータポイントを示す非常に直感的な方法です。スピードメーターと同様に、ラジアルゲージは、ユーザーがデータを一目で理解できるようにする方法を提供します。ラジアル ゲージにはさまざまなカスタマイズオプションがあり、入力コントロールとしても機能します。
サンプルを見る