Ignite UIシェープ チャート
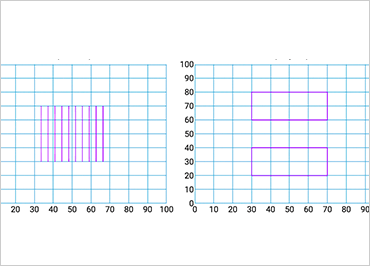
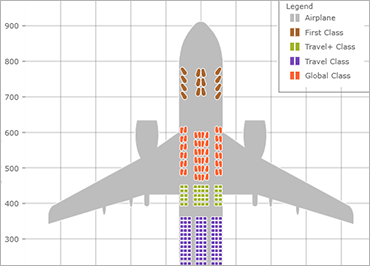
Ignite UIシェープ チャートは、シンプルで直感的なAPIを使用して散布データを表示するように簡単に構成できる、軽量で高性能なグラフです。X / Yデータを配列または配列の配列としてバインドするだけで、残りはチャートが行います。スマート データ アダプターは、バインドされたデータを分析し、適切な視覚化を選択します。たとえば、3 つの数値データ列のセットは、自動的にバブル チャートとしてプロットされます。ChartType オプションを使用してグラフの種類を指定することもできます。ポイント、バブル、エリア、等高線、高密度、ラインスプライン、ポリライン、またはポリゴンから選択します。

損益分岐点データのレンダリング
さらに、少なくとも 1 つのデータ項目に FixedCost、VariableCost、SalesRevenue、および SalesUnits データ列がある場合、シェープ チャートは損益分岐点データをレンダリングできます。
