Blazor チャートとグラフの概要
Ignite UI for Blazor チャートおよびグラフは、データ視覚化の広範なライブラリであり、Web アプリやモバイル アプリの魅力的でインタラクティブなチャートやダッシュボードを実現します。速度と美しさを重視して構築され、最新のすべてのブラウザで動作するように設計されており、完全なタッチとインタラクティブ機能により、レスポンシブ ビジュアルをあらゆるデバイスの次のアプリにすばやく簡単に組み込むことができます。
Ignite UI for Blazor チャートは、カテゴリ シリーズ、ファイナンシャル シリーズ、極座標シリーズ、ラジアル シリーズ、範囲シリーズ、散布シリーズ、シェイプ シリーズ、地理空間シリーズなど、あらゆるタイプのデータを視覚化できる 65 種類以上のシリーズと組み合わせをサポートします。実行している比較のタイプ、または伝えようとしているデータ ストーリーのタイプに関係なく、次のいずれかの方法でデータを表すことができます:
- 時間毎の変化
- 比較
- 相関
- 配布
- 地理空間
- 概要 + 詳細
- 部分から全体
- ランキング
インフラジスティックスの Blazor チャートを使用して、最もニーズの高い視覚化を強化してください。
Blazor WebAssembly および Blazor Server 向けに最適化された 60 以上の高性能チャートを使用 とグラフを使用して、生データを魅力的な視覚化に変換し、最高の UX を実現します。
Blazor チャートとグラフのタイプ
Blazor 製品には、単一のチャート表示からインタラクティブなダッシュボードまで、あらゆるシナリオに対応する 65 を超えるさまざまなチャートおよびグラフ タイプがあります。モバイル アプリやウェブ アプリ用に、円、棒、エリア、折れ線、ポイント、積層型、ドーナツ、散布、ゲージ、極座標、ツリーマップ、株価、ファイナンシャル、地理空間マップなどの Blazor チャートを作成できます。Blazor チャートと他のチャートの利点は、次のような機能が完全にサポートされていることです:
- 組み込まれたレスポンシブ Web デザイン
- マウス、キーボード、タッチを使用したインタラクティブなパンとズーム
- チャート アニメーションのフル コントロール
- チャート ドリルダウン イベント
- リアルタイム ストリーミングのサポート
- 大量 (数百万のデータ ポイント) のサポート
- トレンドラインおよびその他のデータ分析機能
Blazor チャートは、軸、マーカー、シリーズ、凡例、および注釈レイヤーのモジュラー デザインで構築されており、あらゆるタイプのデータ ストーリーの描画を簡単にデザインできます。単一のデータ シリーズを使用して単純なチャートを作成するか、複合ビューに複数の軸があるデータの複数シリーズを使用してより複雑なデータ ストーリーを作成します。
カテゴリおよびファイナンシャル (財務) チャートとデータ チャートの比較
Blazor カテゴリとファイナンシャル チャートは、ドメイン固有のチャートと呼ばれるものです。これは、ドメインがカテゴリまたは財務価格シリーズであることを前提とした Blazor データ チャートのラッパーです。
これらの特定のドメイン チャートを選択すると、API が簡素化され、軸、系列、注釈などの属性を明示的に定義する必要なく、データに関する多くのインターフェイスを描画してチャート シナリオを自動的に構成できます。対照的に、データ チャートは非常に明示的であり、チャートのすべての重要な部分を定義する必要があります。
ドメイン チャートはその中核でデータ チャートを使用しています。したがって、同じパフォーマンスの最適化が両方に適用されます。違いは、開発者にとって非常に簡単に指定できるようにしようとしているのか、それとも可能な限り柔軟にしようとしているのかにあります。Blazor データ チャートはより詳細であり、必要なすべてのチャート機能を利用できるようになり、たとえば、任意の数の系列、軸、または注釈を組み合わせて組み合わせることができます。カテゴリ チャートとファイナンシャル チャートでは、数値 X 軸を持つ散布系列を含む系列など、データ チャートの方が適している、簡単に実行できない状況が存在する可能性があります。
最初はどのチャートを選択すればよいのか判断するのが難しいかもしれません。シリーズのタイプと、提示したい追加機能の数を理解することが重要です。より軽量の基本カテゴリまたはファイナンシャル シリーズの場合は、ドメイン チャートのいずれかを使用することをお勧めします。より高度なシナリオの場合は、カテゴリ チャートの ChartType
プロパティでカバーされるもの以外のもの (積層シリーズや散布シリーズ、数値データや時間ベースのデータなど) を表示するなど、Blazor データ チャートの使用をお勧めします。Blazor ファイナンシャル チャートでは、縦棒、OHLC バー、ローソク足、折れ線シリーズ タイプのみがカバーされていることに注意してください。
Blazor カテゴリとファイナンシャル チャートを使いやすくしていますが、将来はいつでもデータ チャートに切り替えることができます。
Blazor 棒チャート
Blazor 棒チャート (棒グラフ) は、さまざまなカテゴリのデータの頻度、カウント、合計、または平均を、同じ幅と異なる長さの水平棒でエンコードされたデータとすばやく比較するために使用される最も一般的なカテゴリ チャート タイプの 1 つです。これらは、時間の経過に伴う項目の価値の変動、データ分布、ソートされたデータのランキング (高から低、最悪から最高) を表示するのに理想的です。データは、チャートの左から右にデータ ポイントの値に向かって伸びる長方形のコレクションを使用して表されます。棒チャートの詳細をご覧ください。
using System;
using System.Collections.Generic;
public class HighestGrossingMoviesItem
{
public string Franchise { get; set; }
public double TotalRevenue { get; set; }
public double HighestGrossing { get; set; }
}
public class HighestGrossingMovies
: List<HighestGrossingMoviesItem>
{
public HighestGrossingMovies()
{
this.Add(new HighestGrossingMoviesItem()
{
Franchise = @"Marvel Universe",
TotalRevenue = 22.55,
HighestGrossing = 2.8
});
this.Add(new HighestGrossingMoviesItem()
{
Franchise = @"Star Wars",
TotalRevenue = 10.32,
HighestGrossing = 2.07
});
this.Add(new HighestGrossingMoviesItem()
{
Franchise = @"Harry Potter",
TotalRevenue = 9.19,
HighestGrossing = 1.34
});
this.Add(new HighestGrossingMoviesItem()
{
Franchise = @"Avengers",
TotalRevenue = 7.76,
HighestGrossing = 2.8
});
this.Add(new HighestGrossingMoviesItem()
{
Franchise = @"Spider Man",
TotalRevenue = 7.22,
HighestGrossing = 1.28
});
this.Add(new HighestGrossingMoviesItem()
{
Franchise = @"James Bond",
TotalRevenue = 7.12,
HighestGrossing = 1.11
});
}
}
csusing System;
using System.Net.Http;
using System.Collections.Generic;
using System.Threading.Tasks;
using System.Text;
using Microsoft.AspNetCore.Components.WebAssembly.Hosting;
using Microsoft.Extensions.Configuration;
using Microsoft.Extensions.DependencyInjection;
using Microsoft.Extensions.Logging;
using IgniteUI.Blazor.Controls; // for registering Ignite UI modules
namespace Infragistics.Samples
{
public class Program
{
public static async Task Main(string[] args)
{
var builder = WebAssemblyHostBuilder.CreateDefault(args);
builder.RootComponents.Add<App>("app");
builder.Services.AddScoped(sp => new HttpClient { BaseAddress = new Uri(builder.HostEnvironment.BaseAddress) });
// registering Ignite UI modules
builder.Services.AddIgniteUIBlazor(
typeof(IgbLegendModule),
typeof(IgbDataChartCoreModule),
typeof(IgbDataChartCategoryCoreModule),
typeof(IgbDataChartCategoryModule),
typeof(IgbDataChartInteractivityModule),
typeof(IgbDataChartVerticalCategoryModule),
typeof(IgbDataChartAnnotationModule)
);
await builder.Build().RunAsync();
}
}
}
cs
@using IgniteUI.Blazor.Controls
<div class="container vertical">
<div class="legend-title">
Highest Grossing Movie Franchises
</div>
<div class="legend">
<IgbLegend
Name="legend"
@ref="legend"
Orientation="LegendOrientation.Horizontal">
</IgbLegend>
</div>
<div class="container vertical fill">
<IgbDataChart
Name="Chart"
@ref="chart">
<IgbCategoryYAxis
Name="yAxis"
@ref="yAxis"
Label="Franchise"
UseEnhancedIntervalManagement="true"
EnhancedIntervalPreferMoreCategoryLabels="true"
DataSource="HighestGrossingMovies"
IsInverted="true"
Gap="0.5"
Overlap="-0.1">
</IgbCategoryYAxis>
<IgbNumericXAxis
Name="xAxis"
@ref="xAxis"
Title="Billions of U.S. Dollars">
</IgbNumericXAxis>
<IgbCategoryHighlightLayer
Name="CategoryHighlightLayer"
@ref="categoryHighlightLayer">
</IgbCategoryHighlightLayer>
<IgbBarSeries
Name="BarSeries1"
@ref="barSeries1"
XAxisName="xAxis"
YAxisName="yAxis"
Title="Total Revenue of Franchise"
ValueMemberPath="TotalRevenue"
DataSource="HighestGrossingMovies"
ShowDefaultTooltip="true"
IsTransitionInEnabled="true"
IsHighlightingEnabled="true">
</IgbBarSeries>
<IgbBarSeries
Name="BarSeries2"
@ref="barSeries2"
XAxisName="xAxis"
YAxisName="yAxis"
Title="Highest Grossing Movie in Series"
ValueMemberPath="HighestGrossing"
DataSource="HighestGrossingMovies"
ShowDefaultTooltip="true"
IsTransitionInEnabled="true"
IsHighlightingEnabled="true">
</IgbBarSeries>
<IgbDataToolTipLayer
Name="Tooltips"
@ref="tooltips">
</IgbDataToolTipLayer>
</IgbDataChart>
</div>
</div>
@code {
private Action BindElements { get; set; }
protected override async Task OnAfterRenderAsync(bool firstRender)
{
var legend = this.legend;
var chart = this.chart;
var yAxis = this.yAxis;
var xAxis = this.xAxis;
var categoryHighlightLayer = this.categoryHighlightLayer;
var barSeries1 = this.barSeries1;
var barSeries2 = this.barSeries2;
var tooltips = this.tooltips;
this.BindElements = () => {
chart.Legend = this.legend;
};
this.BindElements();
}
private IgbLegend legend;
private IgbDataChart chart;
private IgbCategoryYAxis yAxis;
private IgbNumericXAxis xAxis;
private IgbCategoryHighlightLayer categoryHighlightLayer;
private IgbBarSeries barSeries1;
private IgbBarSeries barSeries2;
private IgbDataToolTipLayer tooltips;
private HighestGrossingMovies _highestGrossingMovies = null;
public HighestGrossingMovies HighestGrossingMovies
{
get
{
if (_highestGrossingMovies == null)
{
_highestGrossingMovies = new HighestGrossingMovies();
}
return _highestGrossingMovies;
}
}
}
razor/*
CSS styles are loaded from the shared CSS file located at:
https://static.infragistics.com/xplatform/css/samples/
*/
css
このサンプルが気に入りましたか? 完全な Ignite UI for Blazorツールキットにアクセスして、すばやく独自のアプリの作成を開始します。無料でダウンロードできます。
Blazor 円チャート
Blazor 円チャート、または円グラフは、一般的な部分から全体へのチャート タイプです。部分から全体へのチャートは、データセットのカテゴリ (部分) が合計 (全体) 値になる方法を示します。カテゴリは、分析されている合計値に対する値のパーセンテージに基づいて、他のカテゴリに比例して表示されます。円チャートは、データ値を円形または円チャートのセクションとして描画します。各セクションまたは円スライスには、基本データ値に比例する円弧の長さがあります。円スライスで表される合計値は、100 または 100% などの全体の値を表します。円チャートは小さなデータセットに最適で、一目で簡単に読むことができます。円チャートの詳細をご覧ください。
using System;
using System.Collections.Generic;
public class EnergyGlobalDemandItem
{
public double Value { get; set; }
public string Category { get; set; }
public string Summary { get; set; }
}
public class EnergyGlobalDemand
: List<EnergyGlobalDemandItem>
{
public EnergyGlobalDemand()
{
this.Add(new EnergyGlobalDemandItem()
{
Value = 37,
Category = @"Cooling",
Summary = @"Cooling 37%"
});
this.Add(new EnergyGlobalDemandItem()
{
Value = 25,
Category = @"Residential",
Summary = @"Residential 25%"
});
this.Add(new EnergyGlobalDemandItem()
{
Value = 12,
Category = @"Heating",
Summary = @"Heating 12%"
});
this.Add(new EnergyGlobalDemandItem()
{
Value = 11,
Category = @"Lighting",
Summary = @"Lighting 11%"
});
this.Add(new EnergyGlobalDemandItem()
{
Value = 15,
Category = @"Other",
Summary = @"Other 15%"
});
}
}
csusing System;
using System.Net.Http;
using System.Collections.Generic;
using System.Threading.Tasks;
using System.Text;
using Microsoft.AspNetCore.Components.WebAssembly.Hosting;
using Microsoft.Extensions.Configuration;
using Microsoft.Extensions.DependencyInjection;
using Microsoft.Extensions.Logging;
using IgniteUI.Blazor.Controls; // for registering Ignite UI modules
namespace Infragistics.Samples
{
public class Program
{
public static async Task Main(string[] args)
{
var builder = WebAssemblyHostBuilder.CreateDefault(args);
builder.RootComponents.Add<App>("app");
builder.Services.AddScoped(sp => new HttpClient { BaseAddress = new Uri(builder.HostEnvironment.BaseAddress) });
// registering Ignite UI modules
builder.Services.AddIgniteUIBlazor(
typeof(IgbItemLegendModule),
typeof(IgbPieChartModule)
);
await builder.Build().RunAsync();
}
}
}
cs
@using IgniteUI.Blazor.Controls
<div class="container vertical">
<div class="legend-title">
Global Electricity Demand by Energy Use
</div>
<div class="legend">
<IgbItemLegend
Name="legend"
@ref="legend"
Orientation="LegendOrientation.Horizontal">
</IgbItemLegend>
</div>
<div class="container vertical fill">
<IgbPieChart
Name="chart"
@ref="chart"
LegendLabelMemberPath="Category"
LabelMemberPath="Summary"
LabelsPosition="LabelsPosition.BestFit"
ValueMemberPath="Value"
RadiusFactor="0.7"
DataSource="EnergyGlobalDemand">
</IgbPieChart>
</div>
</div>
@code {
private Action BindElements { get; set; }
protected override async Task OnAfterRenderAsync(bool firstRender)
{
var legend = this.legend;
var chart = this.chart;
this.BindElements = () => {
chart.Legend = this.legend;
};
this.BindElements();
}
private IgbItemLegend legend;
private IgbPieChart chart;
private EnergyGlobalDemand _energyGlobalDemand = null;
public EnergyGlobalDemand EnergyGlobalDemand
{
get
{
if (_energyGlobalDemand == null)
{
_energyGlobalDemand = new EnergyGlobalDemand();
}
return _energyGlobalDemand;
}
}
}
razor/*
CSS styles are loaded from the shared CSS file located at:
https://static.infragistics.com/xplatform/css/samples/
*/
css
Blazor 折れ線チャート
Blazor 折れ線チャート、または折れ線グラフは、傾向を示し、比較分析を実行するために、一定期間にわたる 1 つ以上の数量の直線セグメントで接続されたポイントによって表される連続データ値を示す一種のカテゴリ折れ線チャートです。Y 軸 (左側のラベル) は数値を示し、X 軸 (下側のラベル) は時系列または比較カテゴリを示します。比較する 1 つ以上のデータセットを含めることができます。これはチャートで複数の線として描画されます。折れ線チャートの詳細をご覧ください。
using System;
using System.Collections.Generic;
public class CountryRenewableElectricityItem
{
public string Year { get; set; }
public double Europe { get; set; }
public double China { get; set; }
public double America { get; set; }
}
public class CountryRenewableElectricity
: List<CountryRenewableElectricityItem>
{
public CountryRenewableElectricity()
{
this.Add(new CountryRenewableElectricityItem()
{
Year = @"2009",
Europe = 34,
China = 21,
America = 19
});
this.Add(new CountryRenewableElectricityItem()
{
Year = @"2010",
Europe = 43,
China = 26,
America = 24
});
this.Add(new CountryRenewableElectricityItem()
{
Year = @"2011",
Europe = 66,
China = 29,
America = 28
});
this.Add(new CountryRenewableElectricityItem()
{
Year = @"2012",
Europe = 69,
China = 32,
America = 26
});
this.Add(new CountryRenewableElectricityItem()
{
Year = @"2013",
Europe = 58,
China = 47,
America = 38
});
this.Add(new CountryRenewableElectricityItem()
{
Year = @"2014",
Europe = 40,
China = 46,
America = 31
});
this.Add(new CountryRenewableElectricityItem()
{
Year = @"2015",
Europe = 78,
China = 50,
America = 19
});
this.Add(new CountryRenewableElectricityItem()
{
Year = @"2016",
Europe = 13,
China = 90,
America = 52
});
this.Add(new CountryRenewableElectricityItem()
{
Year = @"2017",
Europe = 78,
China = 132,
America = 50
});
this.Add(new CountryRenewableElectricityItem()
{
Year = @"2018",
Europe = 40,
China = 134,
America = 34
});
this.Add(new CountryRenewableElectricityItem()
{
Year = @"2018",
Europe = 40,
China = 134,
America = 34
});
this.Add(new CountryRenewableElectricityItem()
{
Year = @"2019",
Europe = 80,
China = 96,
America = 38
});
}
}
csusing System;
using System.Net.Http;
using System.Collections.Generic;
using System.Threading.Tasks;
using System.Text;
using Microsoft.AspNetCore.Components.WebAssembly.Hosting;
using Microsoft.Extensions.Configuration;
using Microsoft.Extensions.DependencyInjection;
using Microsoft.Extensions.Logging;
using IgniteUI.Blazor.Controls; // for registering Ignite UI modules
namespace Infragistics.Samples
{
public class Program
{
public static async Task Main(string[] args)
{
var builder = WebAssemblyHostBuilder.CreateDefault(args);
builder.RootComponents.Add<App>("app");
builder.Services.AddScoped(sp => new HttpClient { BaseAddress = new Uri(builder.HostEnvironment.BaseAddress) });
// registering Ignite UI modules
builder.Services.AddIgniteUIBlazor(
typeof(IgbLegendModule),
typeof(IgbCategoryChartModule)
);
await builder.Build().RunAsync();
}
}
}
cs
@using IgniteUI.Blazor.Controls
<div class="container vertical">
<div class="legend-title">
Renewable Electricity Generated
</div>
<div class="legend">
<IgbLegend
Name="legend"
@ref="legend"
Orientation="LegendOrientation.Horizontal">
</IgbLegend>
</div>
<div class="container vertical fill">
<IgbCategoryChart
Name="chart"
@ref="chart"
ChartType="CategoryChartType.Line"
IsHorizontalZoomEnabled="false"
IsVerticalZoomEnabled="false"
DataSource="CountryRenewableElectricity"
IncludedProperties="@(new string[] { "Year", "Europe", "China", "America" })"
YAxisTitle="TWh"
YAxisTitleLeftMargin="10"
YAxisTitleRightMargin="5"
YAxisLabelLeftMargin="0"
ComputedPlotAreaMarginMode="ComputedPlotAreaMarginMode.Series">
</IgbCategoryChart>
</div>
</div>
@code {
private Action BindElements { get; set; }
protected override async Task OnAfterRenderAsync(bool firstRender)
{
var legend = this.legend;
var chart = this.chart;
this.BindElements = () => {
chart.Legend = this.legend;
};
this.BindElements();
}
private IgbLegend legend;
private IgbCategoryChart chart;
private CountryRenewableElectricity _countryRenewableElectricity = null;
public CountryRenewableElectricity CountryRenewableElectricity
{
get
{
if (_countryRenewableElectricity == null)
{
_countryRenewableElectricity = new CountryRenewableElectricity();
}
return _countryRenewableElectricity;
}
}
}
razor/*
CSS styles are loaded from the shared CSS file located at:
https://static.infragistics.com/xplatform/css/samples/
*/
css
Blazor ドーナツ チャート
Blazor ドーナツ チャート、またはドーナツ グラフは、円チャートの変形であり、全体の一部を表す円内の変数の発生を比例的に示します。ドーナツ チャートには、円チャートの中央に円形の開口部があり、タイトルまたはカテゴリの説明を表示できます。ドーナツ チャートは、階層データを視覚化するための組み込みサポートを使用して、複数の同心円をサポートできます。ドーナツ チャートの詳細をご覧ください。
using System;
using System.Collections.Generic;
public class EnergyGlobalDemandItem
{
public double Value { get; set; }
public string Category { get; set; }
public string Summary { get; set; }
}
public class EnergyGlobalDemand
: List<EnergyGlobalDemandItem>
{
public EnergyGlobalDemand()
{
this.Add(new EnergyGlobalDemandItem()
{
Value = 37,
Category = @"Cooling",
Summary = @"Cooling 37%"
});
this.Add(new EnergyGlobalDemandItem()
{
Value = 25,
Category = @"Residential",
Summary = @"Residential 25%"
});
this.Add(new EnergyGlobalDemandItem()
{
Value = 12,
Category = @"Heating",
Summary = @"Heating 12%"
});
this.Add(new EnergyGlobalDemandItem()
{
Value = 11,
Category = @"Lighting",
Summary = @"Lighting 11%"
});
this.Add(new EnergyGlobalDemandItem()
{
Value = 15,
Category = @"Other",
Summary = @"Other 15%"
});
}
}
csusing System;
using System.Net.Http;
using System.Collections.Generic;
using System.Threading.Tasks;
using System.Text;
using Microsoft.AspNetCore.Components.WebAssembly.Hosting;
using Microsoft.Extensions.Configuration;
using Microsoft.Extensions.DependencyInjection;
using Microsoft.Extensions.Logging;
using IgniteUI.Blazor.Controls; // for registering Ignite UI modules
namespace Infragistics.Samples
{
public class Program
{
public static async Task Main(string[] args)
{
var builder = WebAssemblyHostBuilder.CreateDefault(args);
builder.RootComponents.Add<App>("app");
builder.Services.AddScoped(sp => new HttpClient { BaseAddress = new Uri(builder.HostEnvironment.BaseAddress) });
// registering Ignite UI modules
builder.Services.AddIgniteUIBlazor(
typeof(IgbItemLegendModule),
typeof(IgbDoughnutChartModule)
);
await builder.Build().RunAsync();
}
}
}
cs
@using IgniteUI.Blazor.Controls
<div class="container vertical">
<div class="legend-title">
Global Electricity Demand by Energy Use
</div>
<div class="legend">
<IgbItemLegend
Name="legend"
@ref="legend"
Orientation="LegendOrientation.Horizontal">
</IgbItemLegend>
</div>
<div class="container vertical fill">
<IgbDoughnutChart
Name="chart"
@ref="chart"
AllowSliceExplosion="true">
<IgbRingSeries
Name="series"
@ref="series"
LabelMemberPath="Summary"
LabelsPosition="LabelsPosition.OutsideEnd"
LabelExtent="30"
ValueMemberPath="Value"
LegendLabelMemberPath="Category"
Outlines="white"
RadiusFactor="0.6"
StartAngle="30"
DataSource="EnergyGlobalDemand">
</IgbRingSeries>
</IgbDoughnutChart>
</div>
</div>
@code {
private Action BindElements { get; set; }
protected override async Task OnAfterRenderAsync(bool firstRender)
{
var legend = this.legend;
var chart = this.chart;
var series = this.series;
this.BindElements = () => {
series.Legend = this.legend;
};
this.BindElements();
}
private IgbItemLegend legend;
private IgbDoughnutChart chart;
private IgbRingSeries series;
private EnergyGlobalDemand _energyGlobalDemand = null;
public EnergyGlobalDemand EnergyGlobalDemand
{
get
{
if (_energyGlobalDemand == null)
{
_energyGlobalDemand = new EnergyGlobalDemand();
}
return _energyGlobalDemand;
}
}
}
razor/*
CSS styles are loaded from the shared CSS file located at:
https://static.infragistics.com/xplatform/css/samples/
*/
css
Blazor エリア チャート
Blazor エリア チャートは、直線セグメントで接続されたポイントのコレクションを使用して描画され、線の下の領域が塗りつぶされます。値は y 軸 (左側のラベル) に表示され、カテゴリは x 軸 (下部のラベル) に表示されます。エリア チャートは、プロットされた値の合計を表示することにより、一定期間の変化量を強調したり、複数の項目や全体の一部の関係を比較したりします。エリア チャートの詳細をご覧ください。
using System;
using System.Collections.Generic;
public class CountryRenewableElectricityItem
{
public string Year { get; set; }
public double Europe { get; set; }
public double China { get; set; }
public double America { get; set; }
}
public class CountryRenewableElectricity
: List<CountryRenewableElectricityItem>
{
public CountryRenewableElectricity()
{
this.Add(new CountryRenewableElectricityItem()
{
Year = @"2009",
Europe = 34,
China = 21,
America = 19
});
this.Add(new CountryRenewableElectricityItem()
{
Year = @"2010",
Europe = 43,
China = 26,
America = 24
});
this.Add(new CountryRenewableElectricityItem()
{
Year = @"2011",
Europe = 66,
China = 29,
America = 28
});
this.Add(new CountryRenewableElectricityItem()
{
Year = @"2012",
Europe = 69,
China = 32,
America = 26
});
this.Add(new CountryRenewableElectricityItem()
{
Year = @"2013",
Europe = 58,
China = 47,
America = 38
});
this.Add(new CountryRenewableElectricityItem()
{
Year = @"2014",
Europe = 40,
China = 46,
America = 31
});
this.Add(new CountryRenewableElectricityItem()
{
Year = @"2015",
Europe = 78,
China = 50,
America = 19
});
this.Add(new CountryRenewableElectricityItem()
{
Year = @"2016",
Europe = 13,
China = 90,
America = 52
});
this.Add(new CountryRenewableElectricityItem()
{
Year = @"2017",
Europe = 78,
China = 132,
America = 50
});
this.Add(new CountryRenewableElectricityItem()
{
Year = @"2018",
Europe = 40,
China = 134,
America = 34
});
this.Add(new CountryRenewableElectricityItem()
{
Year = @"2018",
Europe = 40,
China = 134,
America = 34
});
this.Add(new CountryRenewableElectricityItem()
{
Year = @"2019",
Europe = 80,
China = 96,
America = 38
});
}
}
csusing System;
using System.Net.Http;
using System.Collections.Generic;
using System.Threading.Tasks;
using System.Text;
using Microsoft.AspNetCore.Components.WebAssembly.Hosting;
using Microsoft.Extensions.Configuration;
using Microsoft.Extensions.DependencyInjection;
using Microsoft.Extensions.Logging;
using IgniteUI.Blazor.Controls; // for registering Ignite UI modules
namespace Infragistics.Samples
{
public class Program
{
public static async Task Main(string[] args)
{
var builder = WebAssemblyHostBuilder.CreateDefault(args);
builder.RootComponents.Add<App>("app");
builder.Services.AddScoped(sp => new HttpClient { BaseAddress = new Uri(builder.HostEnvironment.BaseAddress) });
// registering Ignite UI modules
builder.Services.AddIgniteUIBlazor(
typeof(IgbLegendModule),
typeof(IgbCategoryChartModule)
);
await builder.Build().RunAsync();
}
}
}
cs
@using IgniteUI.Blazor.Controls
<div class="container vertical">
<div class="legend-title">
Renewable Electricity Generated
</div>
<div class="legend">
<IgbLegend
Name="legend"
@ref="legend"
Orientation="LegendOrientation.Horizontal">
</IgbLegend>
</div>
<div class="container vertical fill">
<IgbCategoryChart
Name="chart"
@ref="chart"
ChartType="CategoryChartType.Area"
DataSource="CountryRenewableElectricity"
IncludedProperties="@(new string[] { "Year", "Europe", "China", "America" })"
YAxisTitle="TWh"
YAxisTitleLeftMargin="10"
YAxisTitleRightMargin="5"
YAxisLabelLeftMargin="0"
IsHorizontalZoomEnabled="false"
IsVerticalZoomEnabled="false"
ComputedPlotAreaMarginMode="ComputedPlotAreaMarginMode.Series">
</IgbCategoryChart>
</div>
</div>
@code {
private Action BindElements { get; set; }
protected override async Task OnAfterRenderAsync(bool firstRender)
{
var legend = this.legend;
var chart = this.chart;
this.BindElements = () => {
chart.Legend = this.legend;
};
this.BindElements();
}
private IgbLegend legend;
private IgbCategoryChart chart;
private CountryRenewableElectricity _countryRenewableElectricity = null;
public CountryRenewableElectricity CountryRenewableElectricity
{
get
{
if (_countryRenewableElectricity == null)
{
_countryRenewableElectricity = new CountryRenewableElectricity();
}
return _countryRenewableElectricity;
}
}
}
razor/*
CSS styles are loaded from the shared CSS file located at:
https://static.infragistics.com/xplatform/css/samples/
*/
css
Blazor スパークライン チャート
Blazor スパークライン チャート、またはスパークライン グラフは、グリッド セル内や、データ ストーリーを伝えるために単語サイズの視覚化が必要な場所など、小規模なレイアウト内で描画することを目的としたカテゴリ チャートの一種です。他の Blazor チャート タイプと同様に、スパークライン チャートには、チャート タイプ、マーカー、範囲、トレンドライン、不明な値のプロット、ツールチップなど、構成およびカスタマイズできるいくつかの視覚要素と対応する機能があります。スパークライン チャートは、折れ線チャート、エリア チャート、縦棒チャート、または Win/Loss チャートとして描画できます。スパーク チャートに相当するフルサイズのチャートの違いは、Y 軸 (左側のラベル) と X 軸 (下部のラベル) が表示されないことです。スパークライン チャートの詳細をご覧ください。
using System;
using System.Net.Http;
using System.Collections.Generic;
using System.Threading.Tasks;
using System.Text;
using Microsoft.AspNetCore.Components.WebAssembly.Hosting;
using Microsoft.Extensions.Configuration;
using Microsoft.Extensions.DependencyInjection;
using Microsoft.Extensions.Logging;
using IgniteUI.Blazor.Controls; // for registering Ignite UI modules
namespace Infragistics.Samples
{
public class Program
{
public static async Task Main(string[] args)
{
var builder = WebAssemblyHostBuilder.CreateDefault(args);
builder.RootComponents.Add<App>("app");
builder.Services.AddScoped(sp => new HttpClient { BaseAddress = new Uri(builder.HostEnvironment.BaseAddress) });
// registering Ignite UI modules
builder.Services.AddIgniteUIBlazor(typeof(IgbSparklineModule));
await builder.Build().RunAsync();
}
}
}
csusing System;
using System.Collections.Generic;
using System.Linq;
using System.Threading.Tasks;
namespace Infragistics.Samples
{
public class SparklineItem
{
public double Index { get; set; }
public double Value { get; set; }
public double Angle { get; set; }
public double Expanse { get; set; }
public double Income { get; set; }
}
public static class SparklineData
{
public static List<SparklineItem> Generate()
{
var SparklineItems = new List<SparklineItem>();
var index = 0;
var min = 1000.0;
var max = -1000.0;
for (var angle = 0; angle <= 360 * 4.0; angle += 5)
{
var v1 = Math.Sin(angle * Math.PI / 180);
var v2 = Math.Sin(3 * angle * Math.PI / 180) / 3;
var revenue = v1 + v2;
var expanse = revenue < 0 ? revenue : 0;
var income = revenue > 0 ? revenue : 0;
SparklineItems.Add(new SparklineItem()
{
Index = index++,
Angle = angle,
// Value = v1 + v2
Value = revenue,
Expanse = expanse,
Income = income
});
min = Math.Min(min, v1 + v2);
max = Math.Max(max, v1 + v2);
}
return SparklineItems;
}
}
}
cs
@using IgniteUI.Blazor.Controls
<div class="container vertical">
@if (Data != null)
{
<label class="legend-title">Sparkline with Line Display Type</label>
<div class="container" style="padding: 0.5rem;">
<IgbSparkline Height="100%" Width="100%" DataSource="Data"
DisplayType="SparklineDisplayType.Line"
ValueMemberPath="Value"
LabelMemberPath="Angle">
</IgbSparkline>
</div>
<label class="legend-title">Sparkline with Area Display Type</label>
<div class="container" style="padding: 0.5rem;">
<IgbSparkline Height="100%" Width="100%" DataSource="Data"
DisplayType="SparklineDisplayType.Area"
ValueMemberPath="Value"
LabelMemberPath="Angle">
</IgbSparkline>
</div>
<label class="legend-title">Sparkline with Column Display Type</label>
<div class="container" style="padding: 0.5rem;">
<IgbSparkline Height="100%" Width="100%" DataSource="Data"
DisplayType="SparklineDisplayType.Column"
ValueMemberPath="Value"
LabelMemberPath="Angle">
</IgbSparkline>
</div>
<label class="legend-title">Sparkline with Win/Loss Display Type</label>
<div class="container" style="padding: 0.5rem;">
<IgbSparkline Height="100%" Width="100%" DataSource="Data"
DisplayType="SparklineDisplayType.WinLoss"
ValueMemberPath="Value"
LabelMemberPath="Angle">
</IgbSparkline>
</div>
}
</div>
@code {
private List<SparklineItem> Data;
protected override void OnInitialized()
{
this.Data = SparklineData.Generate();
}
}
razor/*
CSS styles are loaded from the shared CSS file located at:
https://static.infragistics.com/xplatform/css/samples/
*/
css
Blazor バブル チャート
Blazor バブル チャート (バブル グラフ) は、3 つの数値で構成されるデータを表示するために使用されます。値の 2 つは、デカルト (X、Y) 座標系を使用して交点としてプロットされ、3 番目の値は点の直径サイズとして描画されます。これにより、バブル チャートにその名前が付けられます。これは、プロットの X 座標と Y 座標に沿ったさまざまなサイズのバブルの視覚化です。Blazor バブル チャートは、データ相関とサイズによって描画されたデータ値の違いとの関係を示すために使用されます。4 番目のデータ ディメンション (通常は色) を使用して、バブル チャートの値をさらに区別することもできます。バブル チャートの詳細をご覧ください。
using System;
using System.Collections.Generic;
public class CountryStatsAfricaItem
{
public string Code { get; set; }
public double Population { get; set; }
public double WorkedHours { get; set; }
public double GDP { get; set; }
public string Name { get; set; }
}
public class CountryStatsAfrica
: List<CountryStatsAfricaItem>
{
public CountryStatsAfrica()
{
this.Add(new CountryStatsAfricaItem()
{
Code = @"DZA",
Population = 39728000,
WorkedHours = 47.5,
GDP = 13725,
Name = @"Algeria"
});
this.Add(new CountryStatsAfricaItem()
{
Code = @"AGO",
Population = 27884000,
WorkedHours = 39.8,
GDP = 6228,
Name = @"Angola"
});
this.Add(new CountryStatsAfricaItem()
{
Code = @"BEN",
Population = 10576000,
WorkedHours = 43.7,
GDP = 1987,
Name = @"Benin"
});
this.Add(new CountryStatsAfricaItem()
{
Code = @"BWA",
Population = 2121000,
WorkedHours = 41.2,
GDP = 15357,
Name = @"Botswana"
});
this.Add(new CountryStatsAfricaItem()
{
Code = @"BFA",
Population = 18111000,
WorkedHours = 39.3,
GDP = 1596,
Name = @"Burkina Faso"
});
this.Add(new CountryStatsAfricaItem()
{
Code = @"BDI",
Population = 10160000,
WorkedHours = 36.4,
GDP = 748,
Name = @"Burundi"
});
this.Add(new CountryStatsAfricaItem()
{
Code = @"CMR",
Population = 23298000,
WorkedHours = 42,
GDP = 3289,
Name = @"Cameroon"
});
this.Add(new CountryStatsAfricaItem()
{
Code = @"CPV",
Population = 525000,
WorkedHours = 45,
GDP = 5915,
Name = @"Cape Verde"
});
this.Add(new CountryStatsAfricaItem()
{
Code = @"CAF",
Population = 4493000,
WorkedHours = 38,
GDP = 622,
Name = @"Central African Republic"
});
this.Add(new CountryStatsAfricaItem()
{
Code = @"TCD",
Population = 14111000,
WorkedHours = 40.4,
GDP = 2067,
Name = @"Chad"
});
this.Add(new CountryStatsAfricaItem()
{
Code = @"COM",
Population = 777000,
WorkedHours = 40.1,
GDP = 1413,
Name = @"Comoros"
});
this.Add(new CountryStatsAfricaItem()
{
Code = @"COG",
Population = 4856000,
WorkedHours = 38.1,
GDP = 5543,
Name = @"Congo"
});
this.Add(new CountryStatsAfricaItem()
{
Code = @"CIV",
Population = 23226000,
WorkedHours = 39.7,
GDP = 3242,
Name = @"Cote Ivoire"
});
this.Add(new CountryStatsAfricaItem()
{
Code = @"COD",
Population = 76245000,
WorkedHours = 44,
GDP = 812,
Name = @"Democratic Republic of Congo"
});
this.Add(new CountryStatsAfricaItem()
{
Code = @"EGY",
Population = 92443000,
WorkedHours = 39.7,
GDP = 10096,
Name = @"Egypt"
});
this.Add(new CountryStatsAfricaItem()
{
Code = @"GNQ",
Population = 1169000,
WorkedHours = 38.8,
GDP = 27554,
Name = @"Equatorial Guinea"
});
this.Add(new CountryStatsAfricaItem()
{
Code = @"SWZ",
Population = 1104000,
WorkedHours = 45.7,
GDP = 7759,
Name = @"Eswatini"
});
this.Add(new CountryStatsAfricaItem()
{
Code = @"ETH",
Population = 101000000,
WorkedHours = 40.1,
GDP = 1533,
Name = @"Ethiopia"
});
this.Add(new CountryStatsAfricaItem()
{
Code = @"GAB",
Population = 1948000,
WorkedHours = 40.5,
GDP = 16837,
Name = @"Gabon"
});
this.Add(new CountryStatsAfricaItem()
{
Code = @"GMB",
Population = 2086000,
WorkedHours = 40.3,
GDP = 1568,
Name = @"Gambia"
});
this.Add(new CountryStatsAfricaItem()
{
Code = @"GHA",
Population = 27849000,
WorkedHours = 47.6,
GDP = 3927,
Name = @"Ghana"
});
this.Add(new CountryStatsAfricaItem()
{
Code = @"GIN",
Population = 11432000,
WorkedHours = 43.4,
GDP = 1758,
Name = @"Guinea"
});
this.Add(new CountryStatsAfricaItem()
{
Code = @"GNB",
Population = 1737000,
WorkedHours = 35.1,
GDP = 1446,
Name = @"Guinea-Bissau"
});
this.Add(new CountryStatsAfricaItem()
{
Code = @"KEN",
Population = 47878000,
WorkedHours = 43.9,
GDP = 2836,
Name = @"Kenya"
});
this.Add(new CountryStatsAfricaItem()
{
Code = @"LSO",
Population = 2059000,
WorkedHours = 47.6,
GDP = 2708,
Name = @"Lesotho"
});
this.Add(new CountryStatsAfricaItem()
{
Code = @"LBR",
Population = 4472000,
WorkedHours = 40.3,
GDP = 785,
Name = @"Liberia"
});
this.Add(new CountryStatsAfricaItem()
{
Code = @"LBY",
Population = 6418000,
WorkedHours = 42.5,
GDP = 14847,
Name = @"Libya"
});
this.Add(new CountryStatsAfricaItem()
{
Code = @"MDG",
Population = 24234000,
WorkedHours = 40.8,
GDP = 1377,
Name = @"Madagascar"
});
this.Add(new CountryStatsAfricaItem()
{
Code = @"MWI",
Population = 16745000,
WorkedHours = 44.5,
GDP = 1089,
Name = @"Malawi"
});
this.Add(new CountryStatsAfricaItem()
{
Code = @"MLI",
Population = 17439000,
WorkedHours = 40.6,
GDP = 1919,
Name = @"Mali"
});
this.Add(new CountryStatsAfricaItem()
{
Code = @"MRT",
Population = 4046000,
WorkedHours = 45.9,
GDP = 3602,
Name = @"Mauritania"
});
this.Add(new CountryStatsAfricaItem()
{
Code = @"MUS",
Population = 1259000,
WorkedHours = 44.4,
GDP = 18864,
Name = @"Mauritius"
});
this.Add(new CountryStatsAfricaItem()
{
Code = @"MAR",
Population = 34664000,
WorkedHours = 39.6,
GDP = 7297,
Name = @"Morocco"
});
this.Add(new CountryStatsAfricaItem()
{
Code = @"MOZ",
Population = 27042000,
WorkedHours = 46.7,
GDP = 1118,
Name = @"Mozambique"
});
this.Add(new CountryStatsAfricaItem()
{
Code = @"NAM",
Population = 2315000,
WorkedHours = 43.1,
GDP = 9975,
Name = @"Namibia"
});
this.Add(new CountryStatsAfricaItem()
{
Code = @"NER",
Population = 20002000,
WorkedHours = 45,
GDP = 908,
Name = @"Niger"
});
this.Add(new CountryStatsAfricaItem()
{
Code = @"NGA",
Population = 181000000,
WorkedHours = 32.76,
GDP = 5671,
Name = @"Nigeria"
});
this.Add(new CountryStatsAfricaItem()
{
Code = @"RWA",
Population = 11369000,
WorkedHours = 46.3,
GDP = 1731,
Name = @"Rwanda"
});
this.Add(new CountryStatsAfricaItem()
{
Code = @"STP",
Population = 199000,
WorkedHours = 38.2,
GDP = 2948,
Name = @"Sao Tome"
});
this.Add(new CountryStatsAfricaItem()
{
Code = @"SEN",
Population = 14578000,
WorkedHours = 46.8,
GDP = 2294,
Name = @"Senegal"
});
this.Add(new CountryStatsAfricaItem()
{
Code = @"SYC",
Population = 95000,
WorkedHours = 39.8,
GDP = 24857,
Name = @"Seychelles"
});
this.Add(new CountryStatsAfricaItem()
{
Code = @"SLE",
Population = 7172000,
WorkedHours = 35.4,
GDP = 1314,
Name = @"Sierra Leone"
});
this.Add(new CountryStatsAfricaItem()
{
Code = @"ZAF",
Population = 55386000,
WorkedHours = 42.48,
GDP = 12378,
Name = @"South Africa"
});
this.Add(new CountryStatsAfricaItem()
{
Code = @"SSD",
Population = 10716000,
WorkedHours = 39.3,
GDP = 1875,
Name = @"South Sudan"
});
this.Add(new CountryStatsAfricaItem()
{
Code = @"SDN",
Population = 38903000,
WorkedHours = 36.3,
GDP = 4290,
Name = @"Sudan"
});
this.Add(new CountryStatsAfricaItem()
{
Code = @"TZA",
Population = 51483000,
WorkedHours = 38,
GDP = 2491,
Name = @"Tanzania"
});
this.Add(new CountryStatsAfricaItem()
{
Code = @"TGO",
Population = 7323000,
WorkedHours = 38.8,
GDP = 1351,
Name = @"Togo"
});
this.Add(new CountryStatsAfricaItem()
{
Code = @"TUN",
Population = 11180000,
WorkedHours = 35.2,
GDP = 10766,
Name = @"Tunisia"
});
this.Add(new CountryStatsAfricaItem()
{
Code = @"UGA",
Population = 38225000,
WorkedHours = 38.6,
GDP = 1666,
Name = @"Uganda"
});
this.Add(new CountryStatsAfricaItem()
{
Code = @"ZMB",
Population = 15879000,
WorkedHours = 46.6,
GDP = 3627,
Name = @"Zambia"
});
this.Add(new CountryStatsAfricaItem()
{
Code = @"ZWE",
Population = 13815000,
WorkedHours = 41.4,
GDP = 1912,
Name = @"Zimbabwe"
});
}
}
csusing System;
using System.Collections.Generic;
public class CountryStatsEuropeItem
{
public string Code { get; set; }
public double Population { get; set; }
public double WorkedHours { get; set; }
public double GDP { get; set; }
public string Name { get; set; }
}
public class CountryStatsEurope
: List<CountryStatsEuropeItem>
{
public CountryStatsEurope()
{
this.Add(new CountryStatsEuropeItem()
{
Code = @"ALB",
Population = 2891000,
WorkedHours = 41,
GDP = 10970,
Name = @"Albania"
});
this.Add(new CountryStatsEuropeItem()
{
Code = @"AUT",
Population = 8679000,
WorkedHours = 30.75,
GDP = 44305,
Name = @"Austria"
});
this.Add(new CountryStatsEuropeItem()
{
Code = @"BLR",
Population = 9439000,
WorkedHours = 43.5,
GDP = 17230,
Name = @"Belarus"
});
this.Add(new CountryStatsEuropeItem()
{
Code = @"BEL",
Population = 11288000,
WorkedHours = 29.7,
GDP = 41708,
Name = @"Belgium"
});
this.Add(new CountryStatsEuropeItem()
{
Code = @"BIH",
Population = 3429000,
WorkedHours = 46.5,
GDP = 10932,
Name = @"Bosnia"
});
this.Add(new CountryStatsEuropeItem()
{
Code = @"BGR",
Population = 7200000,
WorkedHours = 31.62,
GDP = 17000,
Name = @"Bulgaria"
});
this.Add(new CountryStatsEuropeItem()
{
Code = @"HRV",
Population = 4233000,
WorkedHours = 35.15,
GDP = 20984,
Name = @"Croatia"
});
this.Add(new CountryStatsEuropeItem()
{
Code = @"CYP",
Population = 1161000,
WorkedHours = 34.42,
GDP = 30549,
Name = @"Cyprus"
});
this.Add(new CountryStatsEuropeItem()
{
Code = @"CZE",
Population = 10601000,
WorkedHours = 33.77,
GDP = 30605,
Name = @"Czechia"
});
this.Add(new CountryStatsEuropeItem()
{
Code = @"DNK",
Population = 5689000,
WorkedHours = 27.16,
GDP = 45459,
Name = @"Denmark"
});
this.Add(new CountryStatsEuropeItem()
{
Code = @"EST",
Population = 1315000,
WorkedHours = 35.61,
GDP = 27550,
Name = @"Estonia"
});
this.Add(new CountryStatsEuropeItem()
{
Code = @"FIN",
Population = 5481000,
WorkedHours = 31.48,
GDP = 38942,
Name = @"Finland"
});
this.Add(new CountryStatsEuropeItem()
{
Code = @"FRA",
Population = 64453000,
WorkedHours = 29.03,
GDP = 37766,
Name = @"France"
});
this.Add(new CountryStatsEuropeItem()
{
Code = @"DEU",
Population = 81787000,
WorkedHours = 26.31,
GDP = 43938,
Name = @"Germany"
});
this.Add(new CountryStatsEuropeItem()
{
Code = @"GRC",
Population = 10660000,
WorkedHours = 39.06,
GDP = 24170,
Name = @"Greece"
});
this.Add(new CountryStatsEuropeItem()
{
Code = @"HUN",
Population = 9778000,
WorkedHours = 36.99,
GDP = 25034,
Name = @"Hungary"
});
this.Add(new CountryStatsEuropeItem()
{
Code = @"ISL",
Population = 330000,
WorkedHours = 29.02,
GDP = 43048,
Name = @"Iceland"
});
this.Add(new CountryStatsEuropeItem()
{
Code = @"IRL",
Population = 4652000,
WorkedHours = 33.47,
GDP = 60818,
Name = @"Ireland"
});
this.Add(new CountryStatsEuropeItem()
{
Code = @"ITA",
Population = 60578000,
WorkedHours = 33.04,
GDP = 34302,
Name = @"Italy"
});
this.Add(new CountryStatsEuropeItem()
{
Code = @"LVA",
Population = 1998000,
WorkedHours = 36.57,
GDP = 23019,
Name = @"Latvia"
});
this.Add(new CountryStatsEuropeItem()
{
Code = @"LTU",
Population = 2932000,
WorkedHours = 35.76,
GDP = 27046,
Name = @"Lithuania"
});
this.Add(new CountryStatsEuropeItem()
{
Code = @"LUX",
Population = 567000,
WorkedHours = 29.25,
GDP = 94089,
Name = @"Luxembourg"
});
this.Add(new CountryStatsEuropeItem()
{
Code = @"MLT",
Population = 434000,
WorkedHours = 37.78,
GDP = 34087,
Name = @"Malta"
});
this.Add(new CountryStatsEuropeItem()
{
Code = @"MDA",
Population = 4071000,
WorkedHours = 41,
GDP = 4747,
Name = @"Moldova"
});
this.Add(new CountryStatsEuropeItem()
{
Code = @"MNE",
Population = 627000,
WorkedHours = 47.2,
GDP = 15290,
Name = @"Montenegro"
});
this.Add(new CountryStatsEuropeItem()
{
Code = @"NLD",
Population = 16938000,
WorkedHours = 27.38,
GDP = 46494,
Name = @"Netherlands"
});
this.Add(new CountryStatsEuropeItem()
{
Code = @"MKD",
Population = 2079000,
WorkedHours = 36.6,
GDP = 12760,
Name = @"North Macedonia"
});
this.Add(new CountryStatsEuropeItem()
{
Code = @"NOR",
Population = 5200000,
WorkedHours = 27.36,
GDP = 64008,
Name = @"Norway"
});
this.Add(new CountryStatsEuropeItem()
{
Code = @"POL",
Population = 38034000,
WorkedHours = 39.4,
GDP = 25300,
Name = @"Poland"
});
this.Add(new CountryStatsEuropeItem()
{
Code = @"PRT",
Population = 10368000,
WorkedHours = 36.06,
GDP = 26608,
Name = @"Portugal"
});
this.Add(new CountryStatsEuropeItem()
{
Code = @"ROU",
Population = 19925000,
WorkedHours = 34.34,
GDP = 20556,
Name = @"Romania"
});
this.Add(new CountryStatsEuropeItem()
{
Code = @"RUS",
Population = 145000000,
WorkedHours = 38.04,
GDP = 24517,
Name = @"Russia"
});
this.Add(new CountryStatsEuropeItem()
{
Code = @"SMR",
Population = 33000,
WorkedHours = 40.1,
GDP = 56372,
Name = @"San Marino"
});
this.Add(new CountryStatsEuropeItem()
{
Code = @"SRB",
Population = 8877000,
WorkedHours = 46.5,
GDP = 13278,
Name = @"Serbia"
});
this.Add(new CountryStatsEuropeItem()
{
Code = @"SVK",
Population = 5436000,
WorkedHours = 33.73,
GDP = 28309,
Name = @"Slovakia"
});
this.Add(new CountryStatsEuropeItem()
{
Code = @"SVN",
Population = 2071000,
WorkedHours = 32.46,
GDP = 29038,
Name = @"Slovenia"
});
this.Add(new CountryStatsEuropeItem()
{
Code = @"ESP",
Population = 46672000,
WorkedHours = 32.68,
GDP = 32291,
Name = @"Spain"
});
this.Add(new CountryStatsEuropeItem()
{
Code = @"SWE",
Population = 9765000,
WorkedHours = 30.96,
GDP = 45679,
Name = @"Sweden"
});
this.Add(new CountryStatsEuropeItem()
{
Code = @"CHE",
Population = 8297000,
WorkedHours = 30.57,
GDP = 57264,
Name = @"Switzerland"
});
this.Add(new CountryStatsEuropeItem()
{
Code = @"UKR",
Population = 44922000,
WorkedHours = 38.6,
GDP = 7465,
Name = @"Ukraine"
});
this.Add(new CountryStatsEuropeItem()
{
Code = @"GBR",
Population = 65860000,
WorkedHours = 32.1,
GDP = 38839,
Name = @"United Kingdom"
});
}
}
csusing System;
using System.Net.Http;
using System.Collections.Generic;
using System.Threading.Tasks;
using System.Text;
using Microsoft.AspNetCore.Components.WebAssembly.Hosting;
using Microsoft.Extensions.Configuration;
using Microsoft.Extensions.DependencyInjection;
using Microsoft.Extensions.Logging;
using IgniteUI.Blazor.Controls; // for registering Ignite UI modules
namespace Infragistics.Samples
{
public class Program
{
public static async Task Main(string[] args)
{
var builder = WebAssemblyHostBuilder.CreateDefault(args);
builder.RootComponents.Add<App>("app");
builder.Services.AddScoped(sp => new HttpClient { BaseAddress = new Uri(builder.HostEnvironment.BaseAddress) });
// registering Ignite UI modules
builder.Services.AddIgniteUIBlazor(
typeof(IgbLegendModule),
typeof(IgbNumberAbbreviatorModule),
typeof(IgbDataChartCoreModule),
typeof(IgbDataChartScatterModule),
typeof(IgbDataChartScatterCoreModule),
typeof(IgbDataChartInteractivityModule)
);
await builder.Build().RunAsync();
}
}
}
cs
@using IgniteUI.Blazor.Controls
<div class="container vertical">
<div class="legend-title">
Total Population of Selected Countries
</div>
<div class="legend">
<IgbLegend
Name="legend"
@ref="legend"
Orientation="LegendOrientation.Horizontal">
</IgbLegend>
</div>
<div class="container vertical fill">
<IgbDataChart
Name="chart"
@ref="chart">
<IgbNumericXAxis
Name="xAxis"
@ref="xAxis"
IsLogarithmic="true"
AbbreviateLargeNumbers="true"
Title="Population">
</IgbNumericXAxis>
<IgbNumericYAxis
Name="yAxis"
@ref="yAxis"
Title="GDP per Capita"
MaximumValue="1000000"
TitleLeftMargin="10"
IsLogarithmic="true"
AbbreviateLargeNumbers="true">
</IgbNumericYAxis>
<IgbBubbleSeries
Name="bubbleSeries1"
@ref="bubbleSeries1"
Title="African Countries"
XAxisName="xAxis"
YAxisName="yAxis"
XMemberPath="Population"
YMemberPath="GDP"
RadiusMemberPath="WorkedHours"
XMemberAsLegendLabel="Population"
YMemberAsLegendLabel="GDP"
RadiusMemberAsLegendLabel="Work Hours"
DataSource="CountryStatsAfrica"
MarkerType="MarkerType.Circle"
ShowDefaultTooltip="true"
RadiusScale="SizeScale1">
</IgbBubbleSeries>
<IgbBubbleSeries
Name="bubbleSeries2"
@ref="bubbleSeries2"
Title="European Countries"
XAxisName="xAxis"
YAxisName="yAxis"
XMemberPath="Population"
YMemberPath="GDP"
RadiusMemberPath="WorkedHours"
XMemberAsLegendLabel="Population"
YMemberAsLegendLabel="GDP"
RadiusMemberAsLegendLabel="Work Hours"
DataSource="CountryStatsEurope"
MarkerType="MarkerType.Circle"
ShowDefaultTooltip="true"
RadiusScale="SizeScale2">
</IgbBubbleSeries>
<IgbDataToolTipLayer
Name="dataToolTipLayer"
@ref="dataToolTipLayer"
ValueRowMarginTop="1"
LabelTextMarginTop="1"
TitleTextMarginTop="1"
UnitsTextMarginTop="1"
ValueRowMarginBottom="1"
LabelTextMarginBottom="1"
TitleTextMarginBottom="1"
UnitsTextMarginBottom="1"
UnitsTextMarginRight="5"
ValueTextMarginLeft="10"
LabelTextMarginLeft="1"
LayoutMode="DataLegendLayoutMode.Vertical">
</IgbDataToolTipLayer>
</IgbDataChart>
</div>
</div>
@code {
private Action BindElements { get; set; }
protected override async Task OnAfterRenderAsync(bool firstRender)
{
var legend = this.legend;
var chart = this.chart;
var xAxis = this.xAxis;
var yAxis = this.yAxis;
var bubbleSeries1 = this.bubbleSeries1;
var bubbleSeries2 = this.bubbleSeries2;
var dataToolTipLayer = this.dataToolTipLayer;
this.BindElements = () => {
chart.Legend = this.legend;
};
this.BindElements();
}
private IgbLegend legend;
private IgbDataChart chart;
private IgbNumericXAxis xAxis;
private IgbNumericYAxis yAxis;
private IgbBubbleSeries bubbleSeries1;
private IgbSizeScale _sizeScale1 = null;
public IgbSizeScale SizeScale1
{
get
{
if (this._sizeScale1 == null)
{
var sizeScale1 = new IgbSizeScale();
sizeScale1.IsLogarithmic = false;
sizeScale1.MinimumValue = 10;
sizeScale1.MaximumValue = 80;
this._sizeScale1 = sizeScale1;
}
return this._sizeScale1;
}
}
private IgbBubbleSeries bubbleSeries2;
private IgbSizeScale _sizeScale2 = null;
public IgbSizeScale SizeScale2
{
get
{
if (this._sizeScale2 == null)
{
var sizeScale2 = new IgbSizeScale();
sizeScale2.IsLogarithmic = false;
sizeScale2.MinimumValue = 10;
sizeScale2.MaximumValue = 80;
this._sizeScale2 = sizeScale2;
}
return this._sizeScale2;
}
}
private IgbDataToolTipLayer dataToolTipLayer;
private CountryStatsAfrica _countryStatsAfrica = null;
public CountryStatsAfrica CountryStatsAfrica
{
get
{
if (_countryStatsAfrica == null)
{
_countryStatsAfrica = new CountryStatsAfrica();
}
return _countryStatsAfrica;
}
}
private CountryStatsEurope _countryStatsEurope = null;
public CountryStatsEurope CountryStatsEurope
{
get
{
if (_countryStatsEurope == null)
{
_countryStatsEurope = new CountryStatsEurope();
}
return _countryStatsEurope;
}
}
}
razor/*
CSS styles are loaded from the shared CSS file located at:
https://static.infragistics.com/xplatform/css/samples/
*/
css
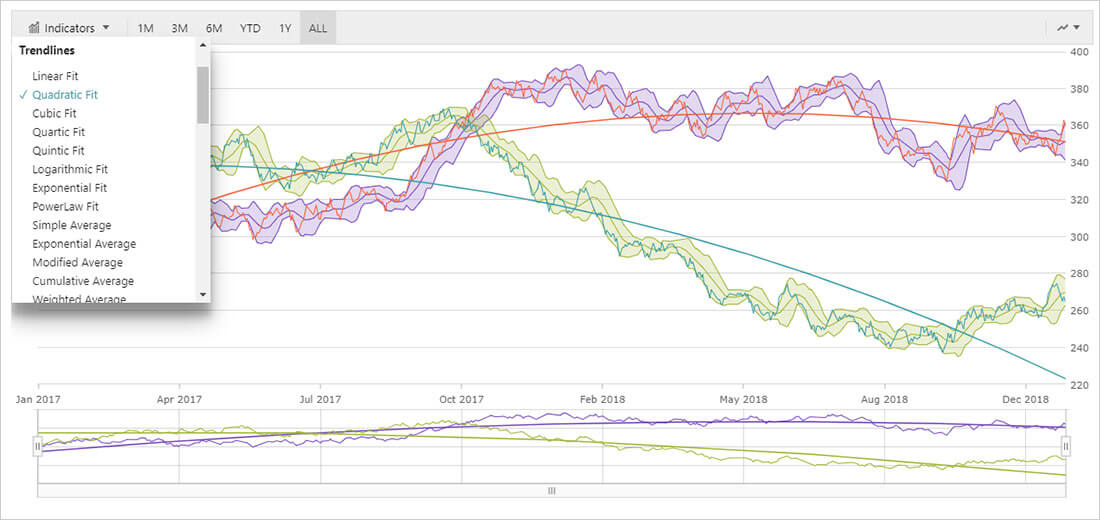
Blazor ファイナンシャル チャート/株価チャート
Blazor ファイナンシャル/株価チャートは、時系列チャートで株価デーとファイナンシャル データを描画する複合視覚化です。日/週/月フィルター、チャート タイプの選択、ボリューム タイプの選択、インジケーターの選択、トレンドラインの選択などのインタラクティブな視覚要素がツールバーに含まれています。カスタマイズ用に設計された Blazor 株価チャートは、データの視覚化と解釈を容易にするために、任意の方法でカスタマイズできます。ファイナンシャル チャートは、X 軸 (下のラベル) に沿って日時データを描画し、Open、High、Low、Close ボリュームなどのフィールドを表示します。時系列データを描画するチャートのタイプは、棒、ローソク、縦棒、または折れ線です。株価チャートの詳細をご覧ください。
using System;
using System.Net.Http;
using System.Collections.Generic;
using System.Threading.Tasks;
using System.Text;
using Microsoft.AspNetCore.Components.WebAssembly.Hosting;
using Microsoft.Extensions.Configuration;
using Microsoft.Extensions.DependencyInjection;
using Microsoft.Extensions.Logging;
using IgniteUI.Blazor.Controls; // for registering Ignite UI modules
namespace Infragistics.Samples
{
public class Program
{
public static async Task Main(string[] args)
{
var builder = WebAssemblyHostBuilder.CreateDefault(args);
builder.RootComponents.Add<App>("app");
builder.Services.AddScoped(sp => new HttpClient { BaseAddress = new Uri(builder.HostEnvironment.BaseAddress) });
// registering Ignite UI modules
builder.Services.AddIgniteUIBlazor(
typeof(IgbFinancialChartModule)
);
await builder.Build().RunAsync();
}
}
}
csusing System;
using System.Collections.Generic;
using System.Linq;
using System.Threading.Tasks;
using System.Net.Http;
using System.Net.Http.Json;
using System.Text.Json;
using System.Text.Json.Serialization;
using System.Globalization;
namespace Infragistics.Samples
{
public class StocksHistory
{
public static async Task<List<StockPrice[]>> GetMultipleStocks()
{
// getting prices of multiples stocks asynchronously
var dataSources = new List<StockPrice[]> {
//await GetAmazonStock(),
await GetGoogleStock(),
await GetMicrosoftStock(),
//await GetTeslaStock()
};
return dataSources;
}
/** gets Amazon stock OHLC prices from a .JSON file */
public static async Task<StockPrice[]> GetAmazonStock()
{
var url = "https://static.infragistics.com/xplatform/data/stocks/stockAmazon.json";
//TODO
// setting data intent for Series Title, e.g. FinancialChart usage
//(stockData as any).__dataIntents = {
// close: ["SeriesTitle/Amazon"]
//};
// console.log("fetchAmazonStock: ", stockData.length);
//var serializeOptions = new JsonSerializerOptions();
//serializeOptions.Converters.Add(new DateTimeConverter());
var http = new HttpClient();
var data = await http.GetFromJsonAsync<StockPrice[]>(url);
foreach (var item in data)
{
var dateArray = item.Date.Split("-");
var d = int.Parse(dateArray[2]);
var m = int.Parse(dateArray[1]) + 1;
var y = int.Parse(dateArray[0]);
item.Time = new DateTime(y, m, d);
}
return data;
}
/** gets Tesla stock OHLC prices from a .JSON file */
public static async Task<StockPrice[]> GetTeslaStock()
{
var url = "https://static.infragistics.com/xplatform/data/stocks/stockTesla.json";
//TODO
// setting data intent for Series Title, e.g. FinancialChart usage
//(stockData as any).__dataIntents = {
// close: ["SeriesTitle/Amazon"]
//};
// console.log("fetchAmazonStock: ", stockData.length);
var serializeOptions = new JsonSerializerOptions();
serializeOptions.Converters.Add(new DateTimeConverter());
var http = new HttpClient();
var data = await http.GetFromJsonAsync<StockPrice[]>(url);
foreach (var item in data)
{
var dateArray = item.Date.Split("-");
var d = int.Parse(dateArray[2]);
var m = int.Parse(dateArray[1]) + 1;
var y = int.Parse(dateArray[0]);
item.Time = new DateTime(y, m, d);
}
return data;
}
/** gets Microsoft stock OHLC prices from a .JSON file */
public static async Task<StockPrice[]> GetMicrosoftStock()
{
var url = "https://static.infragistics.com/xplatform/data/stocks/stockMicrosoft.json";
//TODO
// setting data intent for Series Title, e.g. FinancialChart usage
//(stockData as any).__dataIntents = {
// close: ["SeriesTitle/Amazon"]
//};
// console.log("fetchAmazonStock: ", stockData.length);
var serializeOptions = new JsonSerializerOptions();
serializeOptions.Converters.Add(new DateTimeConverter());
var http = new HttpClient();
var data = await http.GetFromJsonAsync<StockPrice[]>(url);
foreach (var item in data)
{
var dateArray = item.Date.Split("-");
var d = int.Parse(dateArray[2]);
var m = int.Parse(dateArray[1]) + 1;
var y = int.Parse(dateArray[0]);
item.Time = new DateTime(y, m, d);
}
return data;
}
public static async Task<StockPrice[]> GetGoogleStock()
{
var url = "https://static.infragistics.com/xplatform/data/stocks/stockGoogle.json";
//TODO
// setting data intent for Series Title, e.g. FinancialChart usage
//(stockData as any).__dataIntents = {
// close: ["SeriesTitle/Amazon"]
//};
// console.log("fetchAmazonStock: ", stockData.length);
var serializeOptions = new JsonSerializerOptions();
serializeOptions.Converters.Add(new DateTimeConverter());
var http = new HttpClient();
var data = await http.GetFromJsonAsync<StockPrice[]>(url);
foreach (var item in data)
{
var dateArray = item.Date.Split("-");
var d = int.Parse(dateArray[2]);
var m = int.Parse(dateArray[1]) + 1;
var y = int.Parse(dateArray[0]);
item.Time = new DateTime(y, m, d);
}
return data;
}
}
public class DateTimeConverter : JsonConverter<DateTime>
{
public override DateTime Read(
ref Utf8JsonReader reader,
Type typeToConvert,
JsonSerializerOptions options)
{
return DateTime.Now;
}
public override void Write(
Utf8JsonWriter writer,
DateTime date,
JsonSerializerOptions options) =>
writer.WriteStringValue(date.ToString());
}
public class StockPrice
{
public string Date { get; set; }
public DateTime Time { get; set; }
public double Open { get; set; }
public double High { get; set; }
public double Low { get; set; }
public double Close { get; set; }
public double Volume { get; set; }
public int Index { get; set; }
}
}
cs
@using IgniteUI.Blazor.Controls
<div class="container vertical">
@if (Data != null)
{
<IgbFinancialChart Width="100%"
Height="100%"
ChartType=FinancialChartType.Line
Thickness=2
DataSource="Data"
ChartTitle="Google vs Microsoft Changes"
Subtitle="Between 2013 and 2017"
YAxisMode="FinancialChartYAxisMode.PercentChange"
YAxisTitle="Percent Changed"
/>
}
</div>
</div>
@code {
protected List<StockPrice[]> Data;
protected override async Task OnInitializedAsync()
{
this.Data = await StocksHistory.GetMultipleStocks();
}
}
razor/*
CSS styles are loaded from the shared CSS file located at:
https://static.infragistics.com/xplatform/css/samples/
*/
css
Blazor 縦棒チャート
Blazor 縦棒チャート (縦棒グラフ) は、さまざまなカテゴリのデータの頻度、カウント、合計、または平均を、同じ幅と異なる長さの垂直棒でエンコードされたデータとすばやく比較するために使用される最も一般的なカテゴリ チャート タイプの 1 つです。これらは、時間の経過に伴う項目の価値の変動、データ分布、ソートされたデータのランキング (高から低、最悪から最高) を表示するのに理想的です。データは、チャートの上から下にデータ ポイントの値に向かって伸びる長方形のコレクションを使用して表されます。縦棒チャートの詳細をご覧ください。
using System;
using System.Collections.Generic;
public class HighestGrossingMoviesItem
{
public string Franchise { get; set; }
public double TotalRevenue { get; set; }
public double HighestGrossing { get; set; }
}
public class HighestGrossingMovies
: List<HighestGrossingMoviesItem>
{
public HighestGrossingMovies()
{
this.Add(new HighestGrossingMoviesItem()
{
Franchise = @"Marvel Universe",
TotalRevenue = 22.55,
HighestGrossing = 2.8
});
this.Add(new HighestGrossingMoviesItem()
{
Franchise = @"Star Wars",
TotalRevenue = 10.32,
HighestGrossing = 2.07
});
this.Add(new HighestGrossingMoviesItem()
{
Franchise = @"Harry Potter",
TotalRevenue = 9.19,
HighestGrossing = 1.34
});
this.Add(new HighestGrossingMoviesItem()
{
Franchise = @"Avengers",
TotalRevenue = 7.76,
HighestGrossing = 2.8
});
this.Add(new HighestGrossingMoviesItem()
{
Franchise = @"Spider Man",
TotalRevenue = 7.22,
HighestGrossing = 1.28
});
this.Add(new HighestGrossingMoviesItem()
{
Franchise = @"James Bond",
TotalRevenue = 7.12,
HighestGrossing = 1.11
});
}
}
csusing System;
using System.Net.Http;
using System.Collections.Generic;
using System.Threading.Tasks;
using System.Text;
using Microsoft.AspNetCore.Components.WebAssembly.Hosting;
using Microsoft.Extensions.Configuration;
using Microsoft.Extensions.DependencyInjection;
using Microsoft.Extensions.Logging;
using IgniteUI.Blazor.Controls; // for registering Ignite UI modules
namespace Infragistics.Samples
{
public class Program
{
public static async Task Main(string[] args)
{
var builder = WebAssemblyHostBuilder.CreateDefault(args);
builder.RootComponents.Add<App>("app");
builder.Services.AddScoped(sp => new HttpClient { BaseAddress = new Uri(builder.HostEnvironment.BaseAddress) });
// registering Ignite UI modules
builder.Services.AddIgniteUIBlazor(
typeof(IgbLegendModule),
typeof(IgbCategoryChartModule)
);
await builder.Build().RunAsync();
}
}
}
cs
@using IgniteUI.Blazor.Controls
<div class="container vertical">
<div class="legend-title">
Highest Grossing Movie Franchises
</div>
<div class="legend">
<IgbLegend
Name="legend"
@ref="legend"
Orientation="LegendOrientation.Horizontal">
</IgbLegend>
</div>
<div class="container vertical fill">
<IgbCategoryChart
Name="chart"
@ref="chart"
ChartType="CategoryChartType.Column"
DataSource="HighestGrossingMovies"
XAxisInterval="1"
YAxisTitle="Billions of U.S. Dollars"
YAxisTitleLeftMargin="10"
YAxisTitleRightMargin="5"
YAxisLabelLeftMargin="0"
IsHorizontalZoomEnabled="false"
IsVerticalZoomEnabled="false"
IsCategoryHighlightingEnabled="true"
CrosshairsDisplayMode="CrosshairsDisplayMode.None">
</IgbCategoryChart>
</div>
</div>
@code {
private Action BindElements { get; set; }
protected override async Task OnAfterRenderAsync(bool firstRender)
{
var legend = this.legend;
var chart = this.chart;
this.BindElements = () => {
chart.Legend = this.legend;
};
this.BindElements();
}
private IgbLegend legend;
private IgbCategoryChart chart;
private HighestGrossingMovies _highestGrossingMovies = null;
public HighestGrossingMovies HighestGrossingMovies
{
get
{
if (_highestGrossingMovies == null)
{
_highestGrossingMovies = new HighestGrossingMovies();
}
return _highestGrossingMovies;
}
}
}
razor/*
CSS styles are loaded from the shared CSS file located at:
https://static.infragistics.com/xplatform/css/samples/
*/
css
Blazor 複合チャート
Blazor 複合チャートまたはコンボ チャートは、同じプロット領域でさまざまなチャート タイプを組み合わせた視覚化です。スケールが大きく異なり、異なる単位で表される可能性のある 2 つのデータ シリーズを表示する場合に非常に役立ちます。最も一般的な例は、一方の軸にドル、もう一方の軸にパーセンテージです。複合チャートの詳細をご覧ください。
using System;
using System.Net.Http;
using System.Collections.Generic;
using System.Threading.Tasks;
using System.Text;
using Microsoft.AspNetCore.Components.WebAssembly.Hosting;
using Microsoft.Extensions.Configuration;
using Microsoft.Extensions.DependencyInjection;
using Microsoft.Extensions.Logging;
using IgniteUI.Blazor.Controls; // for registering Ignite UI modules
namespace Infragistics.Samples
{
public class Program
{
public static async Task Main(string[] args)
{
var builder = WebAssemblyHostBuilder.CreateDefault(args);
builder.RootComponents.Add<App>("app");
builder.Services.AddScoped(sp => new HttpClient { BaseAddress = new Uri(builder.HostEnvironment.BaseAddress) });
// registering Ignite UI modules
builder.Services.AddIgniteUIBlazor(
typeof(IgbDataChartCoreModule),
typeof(IgbDataChartCategoryCoreModule),
typeof(IgbDataChartCategoryModule),
typeof(IgbDataChartInteractivityModule),
typeof(IgbDataChartAnnotationModule),
typeof(IgbCalloutLayerModule),
typeof(IgbNumberAbbreviatorModule),
typeof(IgbLegendModule)
);
await builder.Build().RunAsync();
}
}
}
csusing System.Collections.Generic;
namespace Infragistics.Samples
{
public class CompanyBudgetInfoWithFormatting
{
public string Date { get; set; }
public double Revenue { get; set; }
public double Expenses { get; set; }
public double RevenueX { get; set; }
public double ExpensesX { get; set; }
public double Income { get; set; }
public double IncomePerRevenue { get; set; }
public string FormattedRevenue { get; set; }
public string FormattedIncome { get; set; }
public string FormattedExpenses { get; set; }
public string FormattedProfit { get; set; }
}
public class CompanyBudgetDataWithFormatting : List<CompanyBudgetInfoWithFormatting>
{
public string FormatNumber(double num)
{
var ret = num;
if (num >= 1000000) return (num / 1000000.0).ToString("0") + "M";
if (num >= 1000) return (num / 1000.0).ToString("0") + "K";
return ret.ToString().Replace(@"/\B(?=(\d{3})+(?!\d))/g", ",");
}
public CompanyBudgetDataWithFormatting()
{
Add(new CompanyBudgetInfoWithFormatting { Date = "Jan 1, 2019", Revenue = 16914, Expenses = 10183 });
Add(new CompanyBudgetInfoWithFormatting { Date = "Mar 1, 2019", Revenue = 15077, Expenses = 12813 });
Add(new CompanyBudgetInfoWithFormatting { Date = "Jun 1, 2019", Revenue = 16886, Expenses = 14476 });
Add(new CompanyBudgetInfoWithFormatting { Date = "Sep 1, 2019", Revenue = 17652, Expenses = 11705 });
Add(new CompanyBudgetInfoWithFormatting { Date = "Jan 1, 2020", Revenue = 21082, Expenses = 14044 });
Add(new CompanyBudgetInfoWithFormatting { Date = "Mar 1, 2020", Revenue = 17737, Expenses = 12803 });
Add(new CompanyBudgetInfoWithFormatting { Date = "Jun 1, 2020", Revenue = 18687, Expenses = 13677 });
Add(new CompanyBudgetInfoWithFormatting { Date = "Sep 1, 2020", Revenue = 21470, Expenses = 13717 });
Add(new CompanyBudgetInfoWithFormatting { Date = "Jan 1, 2021", Revenue = 28072, Expenses = 17133 });
var i = 0;
foreach (var item in this)
{
item.Revenue = item.Revenue * 1000;
item.Expenses = item.Expenses * 1000;
item.Income = item.Revenue - item.Expenses;
item.IncomePerRevenue = (item.Income / item.Revenue * 100);
// calculating x-offset for callouts
item.RevenueX = i;
item.ExpensesX = i;
// formatting values for callouts
item.FormattedRevenue = "$" + FormatNumber(item.Revenue);
item.FormattedIncome = "$" + FormatNumber(item.Income);
item.FormattedExpenses = "$" + FormatNumber(item.Expenses);
item.FormattedProfit = item.IncomePerRevenue + "%";
i++;
}
}
}
}
cs
@using IgniteUI.Blazor.Controls
<div class="container vertical">
<div class="options vertical">
<span class="legend-title">Facebook Statement of Income 2019-2020</span>
<div class="legend">
<IgbLegend @ref="Legend" Orientation="LegendOrientation.Horizontal" />
</div>
</div>
<div class="container vertical">
<IgbDataChart Height="100%" Width="100%" Legend="Legend"
IsHorizontalZoomEnabled="false"
IsVerticalZoomEnabled="false">
<IgbCategoryXAxis Name="xAxis" DataSource="Data" Label="Date" Overlap="0" Gap="0.1" UseClusteringMode="true"/>
<IgbNumericYAxis Name="yAxis1" AbbreviateLargeNumbers="true" Title="In Millions of U.S. Dollars"
MinimumValue="0" MaximumValue="30000000" TitleLeftMargin="5" TitleRightMargin="0"/>
<IgbNumericYAxis Name="yAxis2" AbbreviateLargeNumbers="true" Title="Percentage" MajorStrokeThickness="0"
MinimumValue="0" MaximumValue="160" LabelLocation="AxisLabelsLocation.OutsideRight"
LabelHorizontalAlignment="HorizontalAlignment.Left"/>
<IgbColumnSeries @ref="@RevenueSeries" XAxisName="xAxis" YAxisName="yAxis1" DataSource="Data"
ValueMemberPath="Revenue"
Title="Revenue" MarkerType="MarkerType.Hidden"/>
<IgbColumnSeries @ref="@ExpenseSeries" XAxisName="xAxis" YAxisName="yAxis1" DataSource="Data"
ValueMemberPath="Expenses"
Title="Expenses" MarkerType="MarkerType.Hidden"/>
<IgbSplineAreaSeries @ref="@IncomeSeries" XAxisName="xAxis" YAxisName="yAxis2" DataSource="Data"
ValueMemberPath="IncomePerRevenue"
Title="Income / Revenue %" MarkerType="MarkerType.Circle"/>
<IgbCalloutLayer DataSource="Data" IsAutoCalloutBehaviorEnabled="false" XMemberPath="RevenueX" YMemberPath="Revenue" LabelMemberPath="FormattedRevenue"
TargetSeries="@RevenueSeries"
UseValueForAutoCalloutLabels="false"
CalloutLeaderBrush="Transparent" CalloutTextColor="Black"
CalloutBackground = "Transparent"
CalloutPositionPadding="-5"/>
<IgbCalloutLayer DataSource="Data" IsAutoCalloutBehaviorEnabled="false" XMemberPath="ExpensesX" YMemberPath="Expenses" LabelMemberPath="FormattedExpenses"
TargetSeries="@ExpenseSeries"
UseValueForAutoCalloutLabels="false"
CalloutLeaderBrush="Transparent" CalloutTextColor="Black"
CalloutBackground = "Transparent"
CalloutPositionPadding="-5"/>
<IgbCalloutLayer IsAutoCalloutBehaviorEnabled="true" TargetSeries="@IncomeSeries"
UseValueForAutoCalloutLabels="true" ContentMemberPath="IncomePerRevenue"
CalloutLeaderBrush="Transparent" CalloutTextColor="Black"
CalloutBackground = "LightGray" AutoCalloutLabelPrecision="1"/>
</IgbDataChart>
</div>
</div>
@code {
private IgbLegend _legend;
private IgbLegend Legend
{
get { return _legend; }
set { _legend = value; StateHasChanged(); }
}
private IgbColumnSeries _RevenueSeries;
public IgbColumnSeries RevenueSeries
{
get { return _RevenueSeries; }
set { _RevenueSeries = value; StateHasChanged(); }
}
private IgbColumnSeries _ExpenseSeries;
public IgbColumnSeries ExpenseSeries
{
get { return _ExpenseSeries; }
set { _ExpenseSeries = value; StateHasChanged(); }
}
private IgbSplineAreaSeries _IncomeSeries;
public IgbSplineAreaSeries IncomeSeries
{
get { return _IncomeSeries; }
set { _IncomeSeries = value; StateHasChanged(); }
}
private List<CompanyBudgetInfoWithFormatting> Data = new CompanyBudgetDataWithFormatting();
}
razorfunction onColumnChartStylingMarkerTemplate(o, e) {
let style = { text: "black" };
let size = 12;
return {
measure: function (measureInfo) {
const data = measureInfo.data;
const context = measureInfo.context;
let value = "0.00";
let item = data.item;
if (item != null) {
value = item.Solar.toString();
}
const height = context.measureText("M").width;
const width = context.measureText(value).width;
measureInfo.width = width;
measureInfo.height = height + size;
},
render: function (renderInfo) {
const item = renderInfo.data.item;
const series = renderInfo.data.series;
const valuePath = series.valueColumn.propertyName;
var value = 0;
switch (valuePath) {
case "Solar":
value = item.Solar;
break;
case "Coal":
value = item.Coal;
break;
case "Hydro":
value = item.Hydro;
break;
case "Wind":
value = item.Wind;
break;
case "Nuclear":
value = item.Nuclear;
break;
}
const ctx = renderInfo.context;
let x = renderInfo.xPosition;
let y = renderInfo.yPosition;
if (renderInfo.isHitTestRender) {
ctx.fillStyle = renderInfo.data.actualItemBrush.fill;
let width = renderInfo.availableWidth;
let height = renderInfo.availableHeight;
ctx.fillRect(x - (width / 2), y - (height), renderInfo.availableWidth, renderInfo.availableHeight);
return;
}
let xOffset = 20;
let yOffset = 10;
ctx.font = '8pt Verdana';
ctx.textBaseline = 'top';
ctx.fillStyle = style.text;
if (value < 0) {
ctx.fillText(value + "%", x - (xOffset / 2), y + (yOffset ));
}
else {
ctx.fillText(value + "%", x - (xOffset / 2), y - (yOffset * 2));
}
}
}
}
igRegisterScript("onColumnChartStylingMarkerTemplate", onColumnChartStylingMarkerTemplate, true);
js/*
CSS styles are loaded from the shared CSS file located at:
https://static.infragistics.com/xplatform/css/samples/
*/
css
Blazor 極座標チャート
Blazor 極座標エリア チャートまたは極座標グラフは、極座標チャートのグループに属し、頂点または隅がデータ ポイントの極 (角度/半径) 座標に配置された塗りつぶされたポリゴンの形状を持っています。極座標エリア チャートは、散布図と同じデータ プロットの概念を使用しますが、データ ポイントを水平方向に伸ばすのではなく、円の周りにラップします。他のシリーズ タイプと同じように、複数の極座標エリア チャートは同じデータ チャートにプロットでき、データセットの相違点を示すために互いにオーバーレイできます。極座標チャートの詳細をご覧ください。
using System;
using System.Collections.Generic;
public class BoatSailingDataItem
{
public double Direction { get; set; }
public double BoatSpeed { get; set; }
public double WindSpeed { get; set; }
}
public class BoatSailingData
: List<BoatSailingDataItem>
{
public BoatSailingData()
{
this.Add(new BoatSailingDataItem()
{
Direction = 0,
BoatSpeed = 70,
WindSpeed = 90
});
this.Add(new BoatSailingDataItem()
{
Direction = 45,
BoatSpeed = 35,
WindSpeed = 65
});
this.Add(new BoatSailingDataItem()
{
Direction = 90,
BoatSpeed = 25,
WindSpeed = 45
});
this.Add(new BoatSailingDataItem()
{
Direction = 135,
BoatSpeed = 15,
WindSpeed = 25
});
this.Add(new BoatSailingDataItem()
{
Direction = 180,
BoatSpeed = 0,
WindSpeed = 0
});
this.Add(new BoatSailingDataItem()
{
Direction = 225,
BoatSpeed = 15,
WindSpeed = 25
});
this.Add(new BoatSailingDataItem()
{
Direction = 270,
BoatSpeed = 25,
WindSpeed = 45
});
this.Add(new BoatSailingDataItem()
{
Direction = 315,
BoatSpeed = 35,
WindSpeed = 65
});
this.Add(new BoatSailingDataItem()
{
Direction = 360,
BoatSpeed = 70,
WindSpeed = 90
});
}
}
csusing System;
using System.Net.Http;
using System.Collections.Generic;
using System.Threading.Tasks;
using System.Text;
using Microsoft.AspNetCore.Components.WebAssembly.Hosting;
using Microsoft.Extensions.Configuration;
using Microsoft.Extensions.DependencyInjection;
using Microsoft.Extensions.Logging;
using IgniteUI.Blazor.Controls; // for registering Ignite UI modules
namespace Infragistics.Samples
{
public class Program
{
public static async Task Main(string[] args)
{
var builder = WebAssemblyHostBuilder.CreateDefault(args);
builder.RootComponents.Add<App>("app");
builder.Services.AddScoped(sp => new HttpClient { BaseAddress = new Uri(builder.HostEnvironment.BaseAddress) });
// registering Ignite UI modules
builder.Services.AddIgniteUIBlazor(
typeof(IgbLegendModule),
typeof(IgbDataChartCoreModule),
typeof(IgbDataChartPolarModule),
typeof(IgbDataChartPolarCoreModule),
typeof(IgbDataChartInteractivityModule),
typeof(IgbDataChartAnnotationModule)
);
await builder.Build().RunAsync();
}
}
}
cs
@using IgniteUI.Blazor.Controls
<div class="container vertical">
<div class="legend-title">
Wind Speed vs Boat Speed
</div>
<div class="legend">
<IgbLegend
Name="legend"
@ref="legend"
Orientation="LegendOrientation.Horizontal">
</IgbLegend>
</div>
<div class="container vertical fill">
<IgbDataChart
Name="chart"
@ref="chart"
IsHorizontalZoomEnabled="false"
IsVerticalZoomEnabled="false">
<IgbNumericAngleAxis
Name="angleAxis"
@ref="angleAxis"
StartAngleOffset="-90"
Interval="30"
MinimumValue="0"
MaximumValue="360">
</IgbNumericAngleAxis>
<IgbNumericRadiusAxis
Name="radiusAxis"
@ref="radiusAxis"
RadiusExtentScale="0.9"
InnerRadiusExtentScale="0.1"
Interval="25"
MinimumValue="0"
MaximumValue="100">
</IgbNumericRadiusAxis>
<IgbPolarLineSeries
Name="PolarLineSeries1"
@ref="polarLineSeries1"
DataSource="BoatSailingData"
AngleAxisName="angleAxis"
RadiusAxisName="radiusAxis"
AngleMemberPath="Direction"
RadiusMemberPath="WindSpeed"
ShowDefaultTooltip="false"
Thickness="1"
Title="Wind Speed"
MarkerType="MarkerType.Circle">
</IgbPolarLineSeries>
<IgbPolarLineSeries
Name="PolarLineSeries2"
@ref="polarLineSeries2"
DataSource="BoatSailingData"
AngleAxisName="angleAxis"
RadiusAxisName="radiusAxis"
AngleMemberPath="Direction"
RadiusMemberPath="BoatSpeed"
ShowDefaultTooltip="false"
Thickness="1"
Title="Boat Speed"
MarkerType="MarkerType.Circle">
</IgbPolarLineSeries>
<IgbDataToolTipLayer
Name="dataToolTipLayer"
@ref="dataToolTipLayer">
</IgbDataToolTipLayer>
</IgbDataChart>
</div>
</div>
@code {
private Action BindElements { get; set; }
protected override async Task OnAfterRenderAsync(bool firstRender)
{
var legend = this.legend;
var chart = this.chart;
var angleAxis = this.angleAxis;
var radiusAxis = this.radiusAxis;
var polarLineSeries1 = this.polarLineSeries1;
var polarLineSeries2 = this.polarLineSeries2;
var dataToolTipLayer = this.dataToolTipLayer;
this.BindElements = () => {
chart.Legend = this.legend;
};
this.BindElements();
}
private IgbLegend legend;
private IgbDataChart chart;
private IgbNumericAngleAxis angleAxis;
private IgbNumericRadiusAxis radiusAxis;
private IgbPolarLineSeries polarLineSeries1;
private IgbPolarLineSeries polarLineSeries2;
private IgbDataToolTipLayer dataToolTipLayer;
private BoatSailingData _boatSailingData = null;
public BoatSailingData BoatSailingData
{
get
{
if (_boatSailingData == null)
{
_boatSailingData = new BoatSailingData();
}
return _boatSailingData;
}
}
}
razor/*
CSS styles are loaded from the shared CSS file located at:
https://static.infragistics.com/xplatform/css/samples/
*/
css
Blazor 散布図
Blazor 散布図は、デカルト (X、Y) 座標系を使用してデータをプロットすることにより、2 つの値間の関係を示すために使用されます。各データ ポイントは、X 軸と Y 軸上のデータ値の交点として描画されます。散布図は、不均一な間隔またはデータのクラスターに注意を向けます。予測結果の収集データの標準偏差をハイライト表示し、科学データや統計データをプロットするためによく使用されます。Blazor 散布図は、データがバインド前に時系列になっていない場合でも、X 軸と Y 軸でデータを時系列に整理してプロットします。散布図の詳細をご覧ください。
using System;
using System.Collections.Generic;
public class CountryDemographicAfricanItem
{
public double Population { get; set; }
public double BirthRate { get; set; }
public double DeathRate { get; set; }
public string Name { get; set; }
}
public class CountryDemographicAfrican
: List<CountryDemographicAfricanItem>
{
public CountryDemographicAfrican()
{
this.Add(new CountryDemographicAfricanItem()
{
Population = 39728000,
BirthRate = 23.9,
DeathRate = 4.77,
Name = @"Algeria"
});
this.Add(new CountryDemographicAfricanItem()
{
Population = 27884000,
BirthRate = 42.32,
DeathRate = 8.68,
Name = @"Angola"
});
this.Add(new CountryDemographicAfricanItem()
{
Population = 10576000,
BirthRate = 37.43,
DeathRate = 9.32,
Name = @"Benin"
});
this.Add(new CountryDemographicAfricanItem()
{
Population = 2121000,
BirthRate = 24.14,
DeathRate = 7.02,
Name = @"Botswana"
});
this.Add(new CountryDemographicAfricanItem()
{
Population = 18111000,
BirthRate = 39.44,
DeathRate = 8.82,
Name = @"Burkina Faso"
});
this.Add(new CountryDemographicAfricanItem()
{
Population = 10160000,
BirthRate = 42.66,
DeathRate = 11.03,
Name = @"Burundi"
});
this.Add(new CountryDemographicAfricanItem()
{
Population = 23298000,
BirthRate = 36.84,
DeathRate = 10.35,
Name = @"Cameroon"
});
this.Add(new CountryDemographicAfricanItem()
{
Population = 525000,
BirthRate = 21.14,
DeathRate = 5.61,
Name = @"Cape Verde"
});
this.Add(new CountryDemographicAfricanItem()
{
Population = 4493000,
BirthRate = 36.11,
DeathRate = 14.01,
Name = @"C.A.R."
});
this.Add(new CountryDemographicAfricanItem()
{
Population = 14111000,
BirthRate = 43.86,
DeathRate = 13.22,
Name = @"Chad"
});
this.Add(new CountryDemographicAfricanItem()
{
Population = 777000,
BirthRate = 33.33,
DeathRate = 7.49,
Name = @"Comoros"
});
this.Add(new CountryDemographicAfricanItem()
{
Population = 4856000,
BirthRate = 35.23,
DeathRate = 7.56,
Name = @"Congo"
});
this.Add(new CountryDemographicAfricanItem()
{
Population = 23226000,
BirthRate = 37.1,
DeathRate = 12.54,
Name = @"Cote Ivoire"
});
this.Add(new CountryDemographicAfricanItem()
{
Population = 76245000,
BirthRate = 42.81,
DeathRate = 10.19,
Name = @"DCongo"
});
this.Add(new CountryDemographicAfricanItem()
{
Population = 914000,
BirthRate = 23.35,
DeathRate = 8.37,
Name = @"Djibouti"
});
this.Add(new CountryDemographicAfricanItem()
{
Population = 92443000,
BirthRate = 27.2,
DeathRate = 5.96,
Name = @"Egypt"
});
this.Add(new CountryDemographicAfricanItem()
{
Population = 1169000,
BirthRate = 34.64,
DeathRate = 10.34,
Name = @"Equatorial Guinea"
});
this.Add(new CountryDemographicAfricanItem()
{
Population = 3343000,
BirthRate = 32.83,
DeathRate = 7.07,
Name = @"Eritrea"
});
this.Add(new CountryDemographicAfricanItem()
{
Population = 100835000,
BirthRate = 32.3,
DeathRate = 7,
Name = @"Ethiopia"
});
this.Add(new CountryDemographicAfricanItem()
{
Population = 1948000,
BirthRate = 30.09,
DeathRate = 7.82,
Name = @"Gabon"
});
this.Add(new CountryDemographicAfricanItem()
{
Population = 2086000,
BirthRate = 39.99,
DeathRate = 8.2,
Name = @"Gambia"
});
this.Add(new CountryDemographicAfricanItem()
{
Population = 27849000,
BirthRate = 31.56,
DeathRate = 8.31,
Name = @"Ghana"
});
this.Add(new CountryDemographicAfricanItem()
{
Population = 11432000,
BirthRate = 36.36,
DeathRate = 9.58,
Name = @"Guinea"
});
this.Add(new CountryDemographicAfricanItem()
{
Population = 1737000,
BirthRate = 37.15,
DeathRate = 10.78,
Name = @"Guinea-Bissau"
});
this.Add(new CountryDemographicAfricanItem()
{
Population = 47878000,
BirthRate = 31.78,
DeathRate = 5.84,
Name = @"Kenya"
});
this.Add(new CountryDemographicAfricanItem()
{
Population = 2059000,
BirthRate = 28.16,
DeathRate = 12.92,
Name = @"Lesotho"
});
this.Add(new CountryDemographicAfricanItem()
{
Population = 4472000,
BirthRate = 34.72,
DeathRate = 8.12,
Name = @"Liberia"
});
this.Add(new CountryDemographicAfricanItem()
{
Population = 6418000,
BirthRate = 20.19,
DeathRate = 5.2,
Name = @"Libya"
});
this.Add(new CountryDemographicAfricanItem()
{
Population = 24234000,
BirthRate = 33.4,
DeathRate = 6.48,
Name = @"Madagascar"
});
this.Add(new CountryDemographicAfricanItem()
{
Population = 16745000,
BirthRate = 37.05,
DeathRate = 7.5,
Name = @"Malawi"
});
this.Add(new CountryDemographicAfricanItem()
{
Population = 17439000,
BirthRate = 43.22,
DeathRate = 10.67,
Name = @"Mali"
});
this.Add(new CountryDemographicAfricanItem()
{
Population = 4046000,
BirthRate = 34.57,
DeathRate = 7.96,
Name = @"Mauritania"
});
this.Add(new CountryDemographicAfricanItem()
{
Population = 1259000,
BirthRate = 10.1,
DeathRate = 7.7,
Name = @"Mauritius"
});
this.Add(new CountryDemographicAfricanItem()
{
Population = 34664000,
BirthRate = 20.4,
DeathRate = 5.15,
Name = @"Morocco"
});
this.Add(new CountryDemographicAfricanItem()
{
Population = 27042000,
BirthRate = 39.36,
DeathRate = 10.38,
Name = @"Mozambique"
});
this.Add(new CountryDemographicAfricanItem()
{
Population = 2315000,
BirthRate = 29.59,
DeathRate = 7.46,
Name = @"Namibia"
});
this.Add(new CountryDemographicAfricanItem()
{
Population = 20002000,
BirthRate = 48.44,
DeathRate = 9.94,
Name = @"Niger"
});
this.Add(new CountryDemographicAfricanItem()
{
Population = 181136992,
BirthRate = 39.37,
DeathRate = 12.77,
Name = @"Nigeria"
});
this.Add(new CountryDemographicAfricanItem()
{
Population = 11369000,
BirthRate = 31.79,
DeathRate = 6.13,
Name = @"Rwanda"
});
this.Add(new CountryDemographicAfricanItem()
{
Population = 199000,
BirthRate = 34.33,
DeathRate = 6.81,
Name = @"Sao Tome and Principe"
});
this.Add(new CountryDemographicAfricanItem()
{
Population = 14578000,
BirthRate = 36.21,
DeathRate = 6.07,
Name = @"Senegal"
});
this.Add(new CountryDemographicAfricanItem()
{
Population = 95000,
BirthRate = 17,
DeathRate = 7.5,
Name = @"Seychelles"
});
this.Add(new CountryDemographicAfricanItem()
{
Population = 7172000,
BirthRate = 35.61,
DeathRate = 13.03,
Name = @"Sierra Leone"
});
this.Add(new CountryDemographicAfricanItem()
{
Population = 13797000,
BirthRate = 43.66,
DeathRate = 11.63,
Name = @"Somalia"
});
this.Add(new CountryDemographicAfricanItem()
{
Population = 55386000,
BirthRate = 21.3,
DeathRate = 10.1,
Name = @"South Africa"
});
this.Add(new CountryDemographicAfricanItem()
{
Population = 10716000,
BirthRate = 36.32,
DeathRate = 11.24,
Name = @"South Sudan"
});
this.Add(new CountryDemographicAfricanItem()
{
Population = 38903000,
BirthRate = 33.32,
DeathRate = 7.52,
Name = @"Sudan"
});
this.Add(new CountryDemographicAfricanItem()
{
Population = 1104000,
BirthRate = 29.27,
DeathRate = 9.86,
Name = @"Swaziland"
});
this.Add(new CountryDemographicAfricanItem()
{
Population = 51483000,
BirthRate = 38.64,
DeathRate = 7.02,
Name = @"Tanzania"
});
this.Add(new CountryDemographicAfricanItem()
{
Population = 7323000,
BirthRate = 34.53,
DeathRate = 8.83,
Name = @"Togo"
});
this.Add(new CountryDemographicAfricanItem()
{
Population = 11180000,
BirthRate = 18.65,
DeathRate = 6.36,
Name = @"Tunisia"
});
this.Add(new CountryDemographicAfricanItem()
{
Population = 38225000,
BirthRate = 42.63,
DeathRate = 8.87,
Name = @"Uganda"
});
this.Add(new CountryDemographicAfricanItem()
{
Population = 15879000,
BirthRate = 38.44,
DeathRate = 8,
Name = @"Zambia"
});
this.Add(new CountryDemographicAfricanItem()
{
Population = 13815000,
BirthRate = 33.94,
DeathRate = 8.4,
Name = @"Zimbabwe"
});
}
}
csusing System;
using System.Collections.Generic;
public class CountryDemographicEuropeItem
{
public double Population { get; set; }
public double BirthRate { get; set; }
public double DeathRate { get; set; }
public string Name { get; set; }
}
public class CountryDemographicEurope
: List<CountryDemographicEuropeItem>
{
public CountryDemographicEurope()
{
this.Add(new CountryDemographicEuropeItem()
{
Population = 2891000,
BirthRate = 11.88,
DeathRate = 7.22,
Name = @"Albania"
});
this.Add(new CountryDemographicEuropeItem()
{
Population = 8679000,
BirthRate = 9.8,
DeathRate = 9.6,
Name = @"Austria"
});
this.Add(new CountryDemographicEuropeItem()
{
Population = 9439000,
BirthRate = 12.5,
DeathRate = 12.6,
Name = @"Belarus"
});
this.Add(new CountryDemographicEuropeItem()
{
Population = 11288000,
BirthRate = 10.8,
DeathRate = 9.8,
Name = @"Belgium"
});
this.Add(new CountryDemographicEuropeItem()
{
Population = 3429000,
BirthRate = 9.12,
DeathRate = 10.89,
Name = @"Bosnia"
});
this.Add(new CountryDemographicEuropeItem()
{
Population = 7200000,
BirthRate = 9.2,
DeathRate = 15.3,
Name = @"Bulgaria"
});
this.Add(new CountryDemographicEuropeItem()
{
Population = 165000,
BirthRate = 9.39,
DeathRate = 8.97,
Name = @"Channel Islands"
});
this.Add(new CountryDemographicEuropeItem()
{
Population = 4233000,
BirthRate = 8.9,
DeathRate = 12.9,
Name = @"Croatia"
});
this.Add(new CountryDemographicEuropeItem()
{
Population = 1161000,
BirthRate = 10.98,
DeathRate = 6.84,
Name = @"Cyprus"
});
this.Add(new CountryDemographicEuropeItem()
{
Population = 10601000,
BirthRate = 10.5,
DeathRate = 10.5,
Name = @"Czechia"
});
this.Add(new CountryDemographicEuropeItem()
{
Population = 5689000,
BirthRate = 10.2,
DeathRate = 9.2,
Name = @"Denmark"
});
this.Add(new CountryDemographicEuropeItem()
{
Population = 1315000,
BirthRate = 10.6,
DeathRate = 11.6,
Name = @"Estonia"
});
this.Add(new CountryDemographicEuropeItem()
{
Population = 48000,
BirthRate = 12.4,
DeathRate = 7.7,
Name = @"Faeroe Islands"
});
this.Add(new CountryDemographicEuropeItem()
{
Population = 5481000,
BirthRate = 10.1,
DeathRate = 9.6,
Name = @"Finland"
});
this.Add(new CountryDemographicEuropeItem()
{
Population = 64453000,
BirthRate = 12,
DeathRate = 8.9,
Name = @"France"
});
this.Add(new CountryDemographicEuropeItem()
{
Population = 81787000,
BirthRate = 9,
DeathRate = 11.3,
Name = @"Germany"
});
this.Add(new CountryDemographicEuropeItem()
{
Population = 10660000,
BirthRate = 8.5,
DeathRate = 11.2,
Name = @"Greece"
});
this.Add(new CountryDemographicEuropeItem()
{
Population = 9778000,
BirthRate = 9.4,
DeathRate = 13.4,
Name = @"Hungary"
});
this.Add(new CountryDemographicEuropeItem()
{
Population = 330000,
BirthRate = 12.5,
DeathRate = 6.6,
Name = @"Iceland"
});
this.Add(new CountryDemographicEuropeItem()
{
Population = 4652000,
BirthRate = 14.1,
DeathRate = 6.5,
Name = @"Ireland"
});
this.Add(new CountryDemographicEuropeItem()
{
Population = 60578000,
BirthRate = 8,
DeathRate = 10.7,
Name = @"Italy"
});
this.Add(new CountryDemographicEuropeItem()
{
Population = 1998000,
BirthRate = 11.1,
DeathRate = 14.4,
Name = @"Latvia"
});
this.Add(new CountryDemographicEuropeItem()
{
Population = 37000,
BirthRate = 8.7,
DeathRate = 6.7,
Name = @"Liechtenstein"
});
this.Add(new CountryDemographicEuropeItem()
{
Population = 2932000,
BirthRate = 10.8,
DeathRate = 14.4,
Name = @"Lithuania"
});
this.Add(new CountryDemographicEuropeItem()
{
Population = 567000,
BirthRate = 10.7,
DeathRate = 7,
Name = @"Luxembourg"
});
this.Add(new CountryDemographicEuropeItem()
{
Population = 2079000,
BirthRate = 11.3,
DeathRate = 9.75,
Name = @"Macedonia"
});
this.Add(new CountryDemographicEuropeItem()
{
Population = 434000,
BirthRate = 10,
DeathRate = 8,
Name = @"Malta"
});
this.Add(new CountryDemographicEuropeItem()
{
Population = 4071000,
BirthRate = 10.52,
DeathRate = 11.42,
Name = @"Moldova"
});
this.Add(new CountryDemographicEuropeItem()
{
Population = 38000,
BirthRate = 8.1,
DeathRate = 7.6,
Name = @"Monaco"
});
this.Add(new CountryDemographicEuropeItem()
{
Population = 627000,
BirthRate = 11.52,
DeathRate = 9.8,
Name = @"Montenegro"
});
this.Add(new CountryDemographicEuropeItem()
{
Population = 16938000,
BirthRate = 10.1,
DeathRate = 8.7,
Name = @"Netherlands"
});
this.Add(new CountryDemographicEuropeItem()
{
Population = 5200000,
BirthRate = 11.3,
DeathRate = 7.8,
Name = @"Norway"
});
this.Add(new CountryDemographicEuropeItem()
{
Population = 38034000,
BirthRate = 9.7,
DeathRate = 10.4,
Name = @"Poland"
});
this.Add(new CountryDemographicEuropeItem()
{
Population = 10368000,
BirthRate = 8.3,
DeathRate = 10.5,
Name = @"Portugal"
});
this.Add(new CountryDemographicEuropeItem()
{
Population = 19925000,
BirthRate = 10,
DeathRate = 13.2,
Name = @"Romania"
});
this.Add(new CountryDemographicEuropeItem()
{
Population = 144984992,
BirthRate = 13.3,
DeathRate = 13,
Name = @"Russia"
});
this.Add(new CountryDemographicEuropeItem()
{
Population = 33000,
BirthRate = 8.2,
DeathRate = 7.1,
Name = @"San Marino"
});
this.Add(new CountryDemographicEuropeItem()
{
Population = 8877000,
BirthRate = 9.3,
DeathRate = 14.6,
Name = @"Serbia"
});
this.Add(new CountryDemographicEuropeItem()
{
Population = 5436000,
BirthRate = 10.3,
DeathRate = 9.9,
Name = @"Slovakia"
});
this.Add(new CountryDemographicEuropeItem()
{
Population = 2071000,
BirthRate = 10,
DeathRate = 9.6,
Name = @"Slovenia"
});
this.Add(new CountryDemographicEuropeItem()
{
Population = 46672000,
BirthRate = 9,
DeathRate = 9.1,
Name = @"Spain"
});
this.Add(new CountryDemographicEuropeItem()
{
Population = 9765000,
BirthRate = 11.7,
DeathRate = 9.3,
Name = @"Sweden"
});
this.Add(new CountryDemographicEuropeItem()
{
Population = 8297000,
BirthRate = 10.5,
DeathRate = 8.2,
Name = @"Switzerland"
});
this.Add(new CountryDemographicEuropeItem()
{
Population = 44922000,
BirthRate = 10.7,
DeathRate = 14.9,
Name = @"Ukraine"
});
this.Add(new CountryDemographicEuropeItem()
{
Population = 65860000,
BirthRate = 11.9,
DeathRate = 9.2,
Name = @"United Kingdom"
});
}
}
csusing System;
using System.Net.Http;
using System.Collections.Generic;
using System.Threading.Tasks;
using System.Text;
using Microsoft.AspNetCore.Components.WebAssembly.Hosting;
using Microsoft.Extensions.Configuration;
using Microsoft.Extensions.DependencyInjection;
using Microsoft.Extensions.Logging;
using IgniteUI.Blazor.Controls; // for registering Ignite UI modules
namespace Infragistics.Samples
{
public class Program
{
public static async Task Main(string[] args)
{
var builder = WebAssemblyHostBuilder.CreateDefault(args);
builder.RootComponents.Add<App>("app");
builder.Services.AddScoped(sp => new HttpClient { BaseAddress = new Uri(builder.HostEnvironment.BaseAddress) });
// registering Ignite UI modules
builder.Services.AddIgniteUIBlazor(
typeof(IgbLegendModule),
typeof(IgbDataChartCoreModule),
typeof(IgbDataChartScatterModule),
typeof(IgbDataChartScatterCoreModule),
typeof(IgbDataChartInteractivityModule),
typeof(IgbDataChartAnnotationModule)
);
await builder.Build().RunAsync();
}
}
}
cs
@using IgniteUI.Blazor.Controls
<div class="container vertical">
<div class="legend-title">
Population Statistics for Selected Continents
</div>
<div class="legend">
<IgbLegend
Name="legend"
@ref="legend"
Orientation="LegendOrientation.Horizontal">
</IgbLegend>
</div>
<div class="container vertical fill">
<IgbDataChart
Name="chart"
@ref="chart">
<IgbNumericXAxis
Name="xAxis"
@ref="xAxis"
Title="Death Rate (per 1,000 people)"
MinimumValue="5"
MaximumValue="15">
</IgbNumericXAxis>
<IgbNumericYAxis
Name="yAxis"
@ref="yAxis"
Title="Birth Rate (per 1,000 people)"
MinimumValue="0"
MaximumValue="50"
Interval="10">
</IgbNumericYAxis>
<IgbScatterSeries
Name="scatterSeries1"
@ref="scatterSeries1"
Title="Europe"
XAxisName="xAxis"
YAxisName="yAxis"
XMemberPath="DeathRate"
YMemberPath="BirthRate"
DataSource="CountryDemographicEurope"
MarkerType="MarkerType.Circle"
ShowDefaultTooltip="true">
</IgbScatterSeries>
<IgbScatterSeries
Name="scatterSeries2"
@ref="scatterSeries2"
Title="Africa"
XAxisName="xAxis"
YAxisName="yAxis"
XMemberPath="DeathRate"
YMemberPath="BirthRate"
DataSource="CountryDemographicAfrican"
MarkerType="MarkerType.Circle"
ShowDefaultTooltip="true">
</IgbScatterSeries>
</IgbDataChart>
</div>
</div>
@code {
private Action BindElements { get; set; }
protected override async Task OnAfterRenderAsync(bool firstRender)
{
var legend = this.legend;
var chart = this.chart;
var xAxis = this.xAxis;
var yAxis = this.yAxis;
var scatterSeries1 = this.scatterSeries1;
var scatterSeries2 = this.scatterSeries2;
this.BindElements = () => {
chart.Legend = this.legend;
};
this.BindElements();
}
private IgbLegend legend;
private IgbDataChart chart;
private IgbNumericXAxis xAxis;
private IgbNumericYAxis yAxis;
private IgbScatterSeries scatterSeries1;
private IgbScatterSeries scatterSeries2;
private CountryDemographicEurope _countryDemographicEurope = null;
public CountryDemographicEurope CountryDemographicEurope
{
get
{
if (_countryDemographicEurope == null)
{
_countryDemographicEurope = new CountryDemographicEurope();
}
return _countryDemographicEurope;
}
}
private CountryDemographicAfrican _countryDemographicAfrican = null;
public CountryDemographicAfrican CountryDemographicAfrican
{
get
{
if (_countryDemographicAfrican == null)
{
_countryDemographicAfrican = new CountryDemographicAfrican();
}
return _countryDemographicAfrican;
}
}
}
razor/*
CSS styles are loaded from the shared CSS file located at:
https://static.infragistics.com/xplatform/css/samples/
*/
css
Blazor シェープ チャート
Blazor シェープ チャートは、形状の配列 (X/Y ポイントの配列) を取り、デカルト (x、y) 座標系のポリゴンまたはポリラインのコレクションとして描画するチャートのグループです。これらは、科学データの強調領域でよく使用されますが、ダイアグラム、青写真、さらには建物の間取り図のプロットにも使用できます。シェープ チャートの詳細をご覧ください。
using System;
using System.Net.Http;
using System.Collections.Generic;
using System.Threading.Tasks;
using System.Text;
using Microsoft.AspNetCore.Components.WebAssembly.Hosting;
using Microsoft.Extensions.Configuration;
using Microsoft.Extensions.DependencyInjection;
using Microsoft.Extensions.Logging;
using IgniteUI.Blazor.Controls; // for registering Ignite UI modules
namespace Infragistics.Samples
{
public class Program
{
public static async Task Main(string[] args)
{
var builder = WebAssemblyHostBuilder.CreateDefault(args);
builder.RootComponents.Add<App>("app");
builder.Services.AddScoped(sp => new HttpClient { BaseAddress = new Uri(builder.HostEnvironment.BaseAddress) });
// registering Ignite UI modules
builder.Services.AddIgniteUIBlazor(
typeof(IgbDataChartCoreModule),
typeof(IgbDataChartShapeCoreModule),
typeof(IgbDataChartShapeModule),
typeof(IgbDataChartInteractivityModule),
typeof(IgbScatterPolygonSeriesModule)
);
await builder.Build().RunAsync();
}
}
}
cs
@using IgniteUI.Blazor.Controls
@using System.Net.Http.Json
@inject HttpClient Http
<div class="container vertical">
<div class="options vertical">
<span class="legend-title">Airplane Seating Chart (Polygons)</span>
</div>
<div class="custom-legend">
<div><span style="background: DodgerBlue; "></span><label>First Class</label></div>
<div><span style="background: LimeGreen; "></span><label>Business Class</label></div>
<div><span style="background: Orange; "></span><label>Premium Class</label></div>
<div><span style="background: Red; "></span><label>Economy Class</label></div>
<div><span style="background: Gray; "></span><label>Sold Seat</label> </div>
<div><span style="background: LightGray; "></span><label>Airplane</label> </div>
</div>
@if (AirplaneShape != null && AirplaneSeats != null)
{
<IgbDataChart Height="100%" Width="100%"
SeriesMouseEnterScript="onPolygonSeriesMouseEnter"
IsHorizontalZoomEnabled="true"
IsVerticalZoomEnabled="true">
<IgbNumericXAxis Name="xAxis" MinimumValue="-1000" MaximumValue="1000" Interval="200"></IgbNumericXAxis>
<IgbNumericYAxis Name="yAxis" MinimumValue="-600" MaximumValue="600" Interval="200"></IgbNumericYAxis>
<IgbScatterPolygonSeries XAxisName="xAxis"
YAxisName="yAxis"
DataSource="AirplaneShape"
ShapeMemberPath="Points"
ShowDefaultTooltip="false"
Thickness="0.5"
Brush="LightGray" Outline="Black">
</IgbScatterPolygonSeries>
<IgbScatterPolygonSeries XAxisName="xAxis"
YAxisName="yAxis"
DataSource="AirplaneSeats"
Title="AirplaneSeats"
ShapeMemberPath="Points"
StyleShapeScript="onPolygonShapeStyle">
</IgbScatterPolygonSeries>
</IgbDataChart>
}
</div>
</div>
@code {
private AirplaneSeatInfo[] AirplaneShape;
private AirplaneSeatInfo[] AirplaneSeats;
protected override async Task OnInitializedAsync()
{
var http = new HttpClient();
var shape = "https://static.infragistics.com/xplatform/json/airplane-shape.json";
this.AirplaneShape = await http.GetFromJsonAsync<AirplaneSeatInfo[]>(shape);
var seats = "https://static.infragistics.com/xplatform/json/airplane-seats.json";
this.AirplaneSeats = await http.GetFromJsonAsync<AirplaneSeatInfo[]>(seats);
}
public class AirplaneSeatInfo
{
public string Seat { get; set; }
public string Class { get; set; }
public string Price { get; set; }
public string Status { get; set; }
public List<List<Point>> Points { get; set; }
}
}
razorfunction onPolygonShapeStyle(o, e) {
e.shapeOpacity = 1.0;
e.shapeStrokeThickness = 0.5;
e.shapeStroke = 'Black';
var dataItem = e.item;
if (dataItem.Class === 'First') {
e.shapeFill = 'DodgerBlue';
}
if (dataItem.Class === 'Business') {
e.shapeFill = 'LimeGreen';
}
if (dataItem.Class === 'Premium') {
e.shapeFill = 'Orange';
}
if (dataItem.Class === 'Economy') {
e.shapeFill = 'Red';
}
if (dataItem.Status === 'Sold') {
e.shapeFill = 'Gray';
}
}
igRegisterScript("onPolygonShapeStyle", onPolygonShapeStyle, false);
function onPolygonSeriesMouseEnter(o, e) {
if (e.series.title !== "AirplaneSeats") return;
if (e.series.tooltipTemplate === null ||
e.series.tooltipTemplate === undefined) {
e.series.tooltipTemplate = createPolygonSeriesTooltip;
console.log("onPolygonSeriesMouseEnter ");
}
}
igRegisterScript("onPolygonSeriesMouseEnter", onPolygonSeriesMouseEnter, false);
function createPolygonSeriesTooltip(context) {
if (!context) return null;
var dataItem = context.item;
if (!dataItem) return null;
var tooltip = document.createElement("div");
tooltip.className = "ui-tooltip-content";
var itemClass = document.createElement("div");
itemClass.innerHTML = "Class: " + dataItem.Class;
//itemClass.style.color = "black";
tooltip.appendChild(itemClass);
var itemSeat = document.createElement("div");
itemSeat.innerHTML = "Seat: " + dataItem.Seat;
tooltip.appendChild(itemSeat);
var itemPrice = document.createElement("div");
itemPrice.innerHTML = "Price: $" + dataItem.Price;
tooltip.appendChild(itemPrice);
var itemStatus = document.createElement("div");
itemStatus.innerHTML = "Status: " + dataItem.Status;
tooltip.appendChild(itemStatus);
return tooltip;
}
js/*
CSS styles are loaded from the shared CSS file located at:
https://static.infragistics.com/xplatform/css/samples/
*/
css
Blazor スプライン チャート
Blazor スプライン チャート、またはスプライン グラフは、傾向を示し、比較分析を実行するために、一定期間にわたる 1 つ以上の数量の滑らかな線セグメントで接続されたポイントによって表される連続データ値を示す一種のカテゴリ折れ線チャートです。Y 軸 (左側のラベル) は数値を示し、X 軸 (下側のラベル) は時系列または比較カテゴリを示します。比較する 1 つ以上のデータセットを含めることができます。これはチャートで複数の線として描画されます。Blazor スプライン チャートは Blazor 折れ線チャートと同じですが、唯一の違いは、折れ線チャートが直線で接続された点であるのに対し、スプライン チャートの点は滑らかな曲線で接続されていることです。スプライン チャートの詳細をご覧ください。
using System;
using System.Collections.Generic;
public class CountryRenewableElectricityItem
{
public string Year { get; set; }
public double Europe { get; set; }
public double China { get; set; }
public double America { get; set; }
}
public class CountryRenewableElectricity
: List<CountryRenewableElectricityItem>
{
public CountryRenewableElectricity()
{
this.Add(new CountryRenewableElectricityItem()
{
Year = @"2009",
Europe = 34,
China = 21,
America = 19
});
this.Add(new CountryRenewableElectricityItem()
{
Year = @"2010",
Europe = 43,
China = 26,
America = 24
});
this.Add(new CountryRenewableElectricityItem()
{
Year = @"2011",
Europe = 66,
China = 29,
America = 28
});
this.Add(new CountryRenewableElectricityItem()
{
Year = @"2012",
Europe = 69,
China = 32,
America = 26
});
this.Add(new CountryRenewableElectricityItem()
{
Year = @"2013",
Europe = 58,
China = 47,
America = 38
});
this.Add(new CountryRenewableElectricityItem()
{
Year = @"2014",
Europe = 40,
China = 46,
America = 31
});
this.Add(new CountryRenewableElectricityItem()
{
Year = @"2015",
Europe = 78,
China = 50,
America = 19
});
this.Add(new CountryRenewableElectricityItem()
{
Year = @"2016",
Europe = 13,
China = 90,
America = 52
});
this.Add(new CountryRenewableElectricityItem()
{
Year = @"2017",
Europe = 78,
China = 132,
America = 50
});
this.Add(new CountryRenewableElectricityItem()
{
Year = @"2018",
Europe = 40,
China = 134,
America = 34
});
this.Add(new CountryRenewableElectricityItem()
{
Year = @"2018",
Europe = 40,
China = 134,
America = 34
});
this.Add(new CountryRenewableElectricityItem()
{
Year = @"2019",
Europe = 80,
China = 96,
America = 38
});
}
}
csusing System;
using System.Net.Http;
using System.Collections.Generic;
using System.Threading.Tasks;
using System.Text;
using Microsoft.AspNetCore.Components.WebAssembly.Hosting;
using Microsoft.Extensions.Configuration;
using Microsoft.Extensions.DependencyInjection;
using Microsoft.Extensions.Logging;
using IgniteUI.Blazor.Controls; // for registering Ignite UI modules
namespace Infragistics.Samples
{
public class Program
{
public static async Task Main(string[] args)
{
var builder = WebAssemblyHostBuilder.CreateDefault(args);
builder.RootComponents.Add<App>("app");
builder.Services.AddScoped(sp => new HttpClient { BaseAddress = new Uri(builder.HostEnvironment.BaseAddress) });
// registering Ignite UI modules
builder.Services.AddIgniteUIBlazor(
typeof(IgbLegendModule),
typeof(IgbCategoryChartModule),
typeof(IgbDataChartInteractivityModule)
);
await builder.Build().RunAsync();
}
}
}
cs
@using IgniteUI.Blazor.Controls
<div class="container vertical">
<div class="legend-title">
Renewable Electricity Generated
</div>
<div class="legend">
<IgbLegend
Name="legend"
@ref="legend"
Orientation="LegendOrientation.Horizontal">
</IgbLegend>
</div>
<div class="container vertical fill">
<IgbCategoryChart
Name="chart"
@ref="chart"
ChartType="CategoryChartType.Spline"
DataSource="CountryRenewableElectricity"
YAxisTitle="TWh"
IsTransitionInEnabled="true"
IsHorizontalZoomEnabled="false"
IsVerticalZoomEnabled="false"
ComputedPlotAreaMarginMode="ComputedPlotAreaMarginMode.Series">
</IgbCategoryChart>
</div>
</div>
@code {
private Action BindElements { get; set; }
protected override async Task OnAfterRenderAsync(bool firstRender)
{
var legend = this.legend;
var chart = this.chart;
this.BindElements = () => {
chart.Legend = this.legend;
};
this.BindElements();
}
private IgbLegend legend;
private IgbCategoryChart chart;
private CountryRenewableElectricity _countryRenewableElectricity = null;
public CountryRenewableElectricity CountryRenewableElectricity
{
get
{
if (_countryRenewableElectricity == null)
{
_countryRenewableElectricity = new CountryRenewableElectricity();
}
return _countryRenewableElectricity;
}
}
}
razor/*
CSS styles are loaded from the shared CSS file located at:
https://static.infragistics.com/xplatform/css/samples/
*/
css
Blazor ステップ チャート
Blazor ステップ折れ線チャート、またはステップ折れ線グラフは、ステップ状の進捗を形成する連続した垂直線と水平線で接続されたデータ ポイントのコレクションを描画するカテゴリ チャートです。値は Y 軸 (左側のラベル) に表示され、カテゴリは X 軸 (下部のラベル) に表示されます。Blazor ステップ折れ線チャートは、一定期間の変化量を強調するか、複数の項目を比較します。Blazor ステップ折れ線チャートは、ステップ線の下の領域が塗りつぶされていないことを除いて、すべての点で Blazor ステップエリア チャートと同じです。ステップ折れ線チャートの詳細をご覧ください。
using System;
using System.Collections.Generic;
public class CountryRenewableElectricityItem
{
public string Year { get; set; }
public double Europe { get; set; }
public double China { get; set; }
public double America { get; set; }
}
public class CountryRenewableElectricity
: List<CountryRenewableElectricityItem>
{
public CountryRenewableElectricity()
{
this.Add(new CountryRenewableElectricityItem()
{
Year = @"2009",
Europe = 34,
China = 21,
America = 19
});
this.Add(new CountryRenewableElectricityItem()
{
Year = @"2010",
Europe = 43,
China = 26,
America = 24
});
this.Add(new CountryRenewableElectricityItem()
{
Year = @"2011",
Europe = 66,
China = 29,
America = 28
});
this.Add(new CountryRenewableElectricityItem()
{
Year = @"2012",
Europe = 69,
China = 32,
America = 26
});
this.Add(new CountryRenewableElectricityItem()
{
Year = @"2013",
Europe = 58,
China = 47,
America = 38
});
this.Add(new CountryRenewableElectricityItem()
{
Year = @"2014",
Europe = 40,
China = 46,
America = 31
});
this.Add(new CountryRenewableElectricityItem()
{
Year = @"2015",
Europe = 78,
China = 50,
America = 19
});
this.Add(new CountryRenewableElectricityItem()
{
Year = @"2016",
Europe = 13,
China = 90,
America = 52
});
this.Add(new CountryRenewableElectricityItem()
{
Year = @"2017",
Europe = 78,
China = 132,
America = 50
});
this.Add(new CountryRenewableElectricityItem()
{
Year = @"2018",
Europe = 40,
China = 134,
America = 34
});
this.Add(new CountryRenewableElectricityItem()
{
Year = @"2018",
Europe = 40,
China = 134,
America = 34
});
this.Add(new CountryRenewableElectricityItem()
{
Year = @"2019",
Europe = 80,
China = 96,
America = 38
});
}
}
csusing System;
using System.Net.Http;
using System.Collections.Generic;
using System.Threading.Tasks;
using System.Text;
using Microsoft.AspNetCore.Components.WebAssembly.Hosting;
using Microsoft.Extensions.Configuration;
using Microsoft.Extensions.DependencyInjection;
using Microsoft.Extensions.Logging;
using IgniteUI.Blazor.Controls; // for registering Ignite UI modules
namespace Infragistics.Samples
{
public class Program
{
public static async Task Main(string[] args)
{
var builder = WebAssemblyHostBuilder.CreateDefault(args);
builder.RootComponents.Add<App>("app");
builder.Services.AddScoped(sp => new HttpClient { BaseAddress = new Uri(builder.HostEnvironment.BaseAddress) });
// registering Ignite UI modules
builder.Services.AddIgniteUIBlazor(
typeof(IgbLegendModule),
typeof(IgbCategoryChartModule),
typeof(IgbDataChartInteractivityModule)
);
await builder.Build().RunAsync();
}
}
}
cs
@using IgniteUI.Blazor.Controls
<div class="container vertical">
<div class="legend-title">
Renewable Electricity Generated
</div>
<div class="legend">
<IgbLegend
Name="legend"
@ref="legend"
Orientation="LegendOrientation.Horizontal">
</IgbLegend>
</div>
<div class="container vertical fill">
<IgbCategoryChart
Name="chart"
@ref="chart"
ChartType="CategoryChartType.StepLine"
DataSource="CountryRenewableElectricity"
IncludedProperties="@(new string[] { "Year", "Europe", "China", "America" })"
IsCategoryHighlightingEnabled="true"
IsSeriesHighlightingEnabled="true"
IsHorizontalZoomEnabled="false"
IsVerticalZoomEnabled="false"
XAxisInterval="1"
YAxisTitle="TWh"
CrosshairsSnapToData="true">
</IgbCategoryChart>
</div>
</div>
@code {
private Action BindElements { get; set; }
protected override async Task OnAfterRenderAsync(bool firstRender)
{
var legend = this.legend;
var chart = this.chart;
this.BindElements = () => {
chart.Legend = this.legend;
};
this.BindElements();
}
private IgbLegend legend;
private IgbCategoryChart chart;
private CountryRenewableElectricity _countryRenewableElectricity = null;
public CountryRenewableElectricity CountryRenewableElectricity
{
get
{
if (_countryRenewableElectricity == null)
{
_countryRenewableElectricity = new CountryRenewableElectricity();
}
return _countryRenewableElectricity;
}
}
}
razor/*
CSS styles are loaded from the shared CSS file located at:
https://static.infragistics.com/xplatform/css/samples/
*/
css
Blazor ツリーマップ
Ignite UI for Blazor ツリーマップは、ネストされた一連のノードとして階層 (ツリー構造) データを表示します。ツリーの各ブランチにはツリーマップ ノードが提供されて、サブマップを表す小さなノードでタイル化されます。各ノードの長方形には、データ上の指定されたディメンションに比例した領域があります。多くの場合、ノードは色分けされて、データの個別のディメンションを示します。ツリーマップの詳細をご覧ください。
using System;
using System.Collections.Generic;
public class CountyHierarchicalDataItem
{
public string Code { get; set; }
public string Parent { get; set; }
public string Name { get; set; }
public double Population { get; set; }
}
public class CountyHierarchicalData
: List<CountyHierarchicalDataItem>
{
public CountyHierarchicalData()
{
this.Add(new CountyHierarchicalDataItem()
{
Code = @"AFC",
Parent = null,
Name = @"Africa",
Population = double.NaN
});
this.Add(new CountyHierarchicalDataItem()
{
Code = @"ASA",
Parent = null,
Name = @"Asia",
Population = double.NaN
});
this.Add(new CountyHierarchicalDataItem()
{
Code = @"EUR",
Parent = null,
Name = @"Europe",
Population = double.NaN
});
this.Add(new CountyHierarchicalDataItem()
{
Code = @"MDE",
Parent = null,
Name = @"Middle East",
Population = double.NaN
});
this.Add(new CountyHierarchicalDataItem()
{
Code = @"NAM",
Parent = null,
Name = @"North America",
Population = double.NaN
});
this.Add(new CountyHierarchicalDataItem()
{
Code = @"CAM",
Parent = null,
Name = @"Central America",
Population = double.NaN
});
this.Add(new CountyHierarchicalDataItem()
{
Code = @"SAM",
Parent = null,
Name = @"South America",
Population = double.NaN
});
this.Add(new CountyHierarchicalDataItem()
{
Code = @"OCE",
Parent = null,
Name = @"Oceania",
Population = double.NaN
});
this.Add(new CountyHierarchicalDataItem()
{
Code = @"ANG",
Parent = @"Africa",
Name = @"Angola",
Population = 19618432
});
this.Add(new CountyHierarchicalDataItem()
{
Code = @"BEN",
Parent = @"Africa",
Name = @"Benin",
Population = 9099922
});
this.Add(new CountyHierarchicalDataItem()
{
Code = @"BOT",
Parent = @"Africa",
Name = @"Botswana",
Population = 2030738
});
this.Add(new CountyHierarchicalDataItem()
{
Code = @"BUR",
Parent = @"Africa",
Name = @"Burkina Faso",
Population = 16967845
});
this.Add(new CountyHierarchicalDataItem()
{
Code = @"BUR",
Parent = @"Africa",
Name = @"Burundi",
Population = 8575172
});
this.Add(new CountyHierarchicalDataItem()
{
Code = @"CAM",
Parent = @"Africa",
Name = @"Cameroon",
Population = 20030362
});
this.Add(new CountyHierarchicalDataItem()
{
Code = @"CPV",
Parent = @"Africa",
Name = @"Cape Verde",
Population = 500585
});
this.Add(new CountyHierarchicalDataItem()
{
Code = @"CAR",
Parent = @"Africa",
Name = @"Central African Republic",
Population = 4486837
});
this.Add(new CountyHierarchicalDataItem()
{
Code = @"CHD",
Parent = @"Africa",
Name = @"Chad",
Population = 11525496
});
this.Add(new CountyHierarchicalDataItem()
{
Code = @"COM",
Parent = @"Africa",
Name = @"Comoros",
Population = 753943
});
this.Add(new CountyHierarchicalDataItem()
{
Code = @"DRC",
Parent = @"Africa",
Name = @"Congo DRC",
Population = 67757577
});
this.Add(new CountyHierarchicalDataItem()
{
Code = @"CRP",
Parent = @"Africa",
Name = @"Congo Republic",
Population = 4139748
});
this.Add(new CountyHierarchicalDataItem()
{
Code = @"CIR",
Parent = @"Africa",
Name = @"Cote Ivoire",
Population = 20152894
});
this.Add(new CountyHierarchicalDataItem()
{
Code = @"DBT",
Parent = @"Africa",
Name = @"Djibouti",
Population = 905564
});
this.Add(new CountyHierarchicalDataItem()
{
Code = @"ETG",
Parent = @"Africa",
Name = @"Equatorial Guinea",
Population = 720213
});
this.Add(new CountyHierarchicalDataItem()
{
Code = @"ERT",
Parent = @"Africa",
Name = @"Eritrea",
Population = 5415280
});
this.Add(new CountyHierarchicalDataItem()
{
Code = @"ETH",
Parent = @"Africa",
Name = @"Ethiopia",
Population = 84734262
});
this.Add(new CountyHierarchicalDataItem()
{
Code = @"GBN",
Parent = @"Africa",
Name = @"Gabon",
Population = 1534262
});
this.Add(new CountyHierarchicalDataItem()
{
Code = @"GMB",
Parent = @"Africa",
Name = @"Gambia",
Population = 1776103
});
this.Add(new CountyHierarchicalDataItem()
{
Code = @"GHN",
Parent = @"Africa",
Name = @"Ghana",
Population = 24965816
});
this.Add(new CountyHierarchicalDataItem()
{
Code = @"GUN",
Parent = @"Africa",
Name = @"Guinea",
Population = 10221808
});
this.Add(new CountyHierarchicalDataItem()
{
Code = @"GNB",
Parent = @"Africa",
Name = @"Guinea-Bissau",
Population = 1547061
});
this.Add(new CountyHierarchicalDataItem()
{
Code = @"KEN",
Parent = @"Africa",
Name = @"Kenya",
Population = 41609728
});
this.Add(new CountyHierarchicalDataItem()
{
Code = @"LES",
Parent = @"Africa",
Name = @"Lesotho",
Population = 2193843
});
this.Add(new CountyHierarchicalDataItem()
{
Code = @"LBR",
Parent = @"Africa",
Name = @"Liberia",
Population = 4128572
});
this.Add(new CountyHierarchicalDataItem()
{
Code = @"MDG",
Parent = @"Africa",
Name = @"Madagascar",
Population = 21315135
});
this.Add(new CountyHierarchicalDataItem()
{
Code = @"MLW",
Parent = @"Africa",
Name = @"Malawi",
Population = 15380888
});
this.Add(new CountyHierarchicalDataItem()
{
Code = @"MAL",
Parent = @"Africa",
Name = @"Mali",
Population = 15839538
});
this.Add(new CountyHierarchicalDataItem()
{
Code = @"MRT",
Parent = @"Africa",
Name = @"Mauritania",
Population = 3541540
});
this.Add(new CountyHierarchicalDataItem()
{
Code = @"MUS",
Parent = @"Africa",
Name = @"Mauritius",
Population = 1286051
});
this.Add(new CountyHierarchicalDataItem()
{
Code = @"MOZ",
Parent = @"Africa",
Name = @"Mozambique",
Population = 23929708
});
this.Add(new CountyHierarchicalDataItem()
{
Code = @"NMB",
Parent = @"Africa",
Name = @"Namibia",
Population = 2324004
});
this.Add(new CountyHierarchicalDataItem()
{
Code = @"NER",
Parent = @"Africa",
Name = @"Niger",
Population = 16068994
});
this.Add(new CountyHierarchicalDataItem()
{
Code = @"NGA",
Parent = @"Africa",
Name = @"Nigeria",
Population = 162470737
});
this.Add(new CountyHierarchicalDataItem()
{
Code = @"RWD",
Parent = @"Africa",
Name = @"Rwanda",
Population = 10942950
});
this.Add(new CountyHierarchicalDataItem()
{
Code = @"STM",
Parent = @"Africa",
Name = @"Sao Tome",
Population = 168526
});
this.Add(new CountyHierarchicalDataItem()
{
Code = @"SEN",
Parent = @"Africa",
Name = @"Senegal",
Population = 12767556
});
this.Add(new CountyHierarchicalDataItem()
{
Code = @"SYC",
Parent = @"Africa",
Name = @"Seychelles",
Population = 86000
});
this.Add(new CountyHierarchicalDataItem()
{
Code = @"SRL",
Parent = @"Africa",
Name = @"Sierra Leone",
Population = 5997486
});
this.Add(new CountyHierarchicalDataItem()
{
Code = @"ZAF",
Parent = @"Africa",
Name = @"South Africa",
Population = 50586757
});
this.Add(new CountyHierarchicalDataItem()
{
Code = @"SSD",
Parent = @"Africa",
Name = @"South Sudan",
Population = 10314021
});
this.Add(new CountyHierarchicalDataItem()
{
Code = @"SDN",
Parent = @"Africa",
Name = @"Sudan",
Population = 34318385
});
this.Add(new CountyHierarchicalDataItem()
{
Code = @"SWZ",
Parent = @"Africa",
Name = @"Swaziland",
Population = 1067773
});
this.Add(new CountyHierarchicalDataItem()
{
Code = @"TNZ",
Parent = @"Africa",
Name = @"Tanzania",
Population = 46218486
});
this.Add(new CountyHierarchicalDataItem()
{
Code = @"TOG",
Parent = @"Africa",
Name = @"Togo",
Population = 6154813
});
this.Add(new CountyHierarchicalDataItem()
{
Code = @"UGN",
Parent = @"Africa",
Name = @"Uganda",
Population = 34509205
});
this.Add(new CountyHierarchicalDataItem()
{
Code = @"ZMB",
Parent = @"Africa",
Name = @"Zambia",
Population = 13474959
});
this.Add(new CountyHierarchicalDataItem()
{
Code = @"ZWE",
Parent = @"Africa",
Name = @"Zimbabwe",
Population = 12754378
});
this.Add(new CountyHierarchicalDataItem()
{
Code = @"AFG",
Parent = @"Asia",
Name = @"Afghanistan",
Population = 35320445
});
this.Add(new CountyHierarchicalDataItem()
{
Code = @"BAN",
Parent = @"Asia",
Name = @"Bangladesh",
Population = 150493658
});
this.Add(new CountyHierarchicalDataItem()
{
Code = @"BHT",
Parent = @"Asia",
Name = @"Bhutan",
Population = 738267
});
this.Add(new CountyHierarchicalDataItem()
{
Code = @"BRN",
Parent = @"Asia",
Name = @"Brunei",
Population = 405938
});
this.Add(new CountyHierarchicalDataItem()
{
Code = @"CAM",
Parent = @"Asia",
Name = @"Cambodia",
Population = 14305183
});
this.Add(new CountyHierarchicalDataItem()
{
Code = @"CHI",
Parent = @"Asia",
Name = @"China",
Population = 1344130000
});
this.Add(new CountyHierarchicalDataItem()
{
Code = @"HNK",
Parent = @"Asia",
Name = @"Hong Kong",
Population = 7071600
});
this.Add(new CountyHierarchicalDataItem()
{
Code = @"IND",
Parent = @"Asia",
Name = @"India",
Population = 1241491960
});
this.Add(new CountyHierarchicalDataItem()
{
Code = @"IDN",
Parent = @"Asia",
Name = @"Indonesia",
Population = 242325638
});
this.Add(new CountyHierarchicalDataItem()
{
Code = @"JPN",
Parent = @"Asia",
Name = @"Japan",
Population = 127817277
});
this.Add(new CountyHierarchicalDataItem()
{
Code = @"KZH",
Parent = @"Asia",
Name = @"Kazakhstan",
Population = 16558676
});
this.Add(new CountyHierarchicalDataItem()
{
Code = @"NKO",
Parent = @"Asia",
Name = @"North Korea",
Population = 24451285
});
this.Add(new CountyHierarchicalDataItem()
{
Code = @"SKO",
Parent = @"Asia",
Name = @"South Korea",
Population = 49779000
});
this.Add(new CountyHierarchicalDataItem()
{
Code = @"KGZ",
Parent = @"Asia",
Name = @"Kyrgyzstan",
Population = 5514600
});
this.Add(new CountyHierarchicalDataItem()
{
Code = @"LAO",
Parent = @"Asia",
Name = @"Lao PDR",
Population = 6288037
});
this.Add(new CountyHierarchicalDataItem()
{
Code = @"MAC",
Parent = @"Asia",
Name = @"Macao",
Population = 555731
});
this.Add(new CountyHierarchicalDataItem()
{
Code = @"MYS",
Parent = @"Asia",
Name = @"Malaysia",
Population = 28859154
});
this.Add(new CountyHierarchicalDataItem()
{
Code = @"MDV",
Parent = @"Asia",
Name = @"Maldives",
Population = 320081
});
this.Add(new CountyHierarchicalDataItem()
{
Code = @"MNG",
Parent = @"Asia",
Name = @"Mongolia",
Population = 2800114
});
this.Add(new CountyHierarchicalDataItem()
{
Code = @"MYM",
Parent = @"Asia",
Name = @"Myanmar",
Population = 48336763
});
this.Add(new CountyHierarchicalDataItem()
{
Code = @"NPL",
Parent = @"Asia",
Name = @"Nepal",
Population = 30485798
});
this.Add(new CountyHierarchicalDataItem()
{
Code = @"PHP",
Parent = @"Asia",
Name = @"Philippines",
Population = 94852030
});
this.Add(new CountyHierarchicalDataItem()
{
Code = @"SNG",
Parent = @"Asia",
Name = @"Singapore",
Population = 5183700
});
this.Add(new CountyHierarchicalDataItem()
{
Code = @"SRL",
Parent = @"Asia",
Name = @"Sri Lanka",
Population = 20869000
});
this.Add(new CountyHierarchicalDataItem()
{
Code = @"TKS",
Parent = @"Asia",
Name = @"Tajikistan",
Population = 6976958
});
this.Add(new CountyHierarchicalDataItem()
{
Code = @"THL",
Parent = @"Asia",
Name = @"Thailand",
Population = 69518555
});
this.Add(new CountyHierarchicalDataItem()
{
Code = @"TRK",
Parent = @"Asia",
Name = @"Turkmenistan",
Population = 5105301
});
this.Add(new CountyHierarchicalDataItem()
{
Code = @"UZB",
Parent = @"Asia",
Name = @"Uzbekistan",
Population = 29341200
});
this.Add(new CountyHierarchicalDataItem()
{
Code = @"VTN",
Parent = @"Asia",
Name = @"Vietnam",
Population = 87840000
});
this.Add(new CountyHierarchicalDataItem()
{
Code = @"ANT",
Parent = @"Central America",
Name = @"Antigua",
Population = 89612
});
this.Add(new CountyHierarchicalDataItem()
{
Code = @"ARB",
Parent = @"Central America",
Name = @"Aruba",
Population = 108141
});
this.Add(new CountyHierarchicalDataItem()
{
Code = @"BHM",
Parent = @"Central America",
Name = @"Bahamas",
Population = 347176
});
this.Add(new CountyHierarchicalDataItem()
{
Code = @"BRB",
Parent = @"Central America",
Name = @"Barbados",
Population = 273925
});
this.Add(new CountyHierarchicalDataItem()
{
Code = @"BLZ",
Parent = @"Central America",
Name = @"Belize",
Population = 356600
});
this.Add(new CountyHierarchicalDataItem()
{
Code = @"BRM",
Parent = @"Central America",
Name = @"Bermuda",
Population = 64700
});
this.Add(new CountyHierarchicalDataItem()
{
Code = @"CYI",
Parent = @"Central America",
Name = @"Cayman Islands",
Population = 56729
});
this.Add(new CountyHierarchicalDataItem()
{
Code = @"CSR",
Parent = @"Central America",
Name = @"Costa Rica",
Population = 4726575
});
this.Add(new CountyHierarchicalDataItem()
{
Code = @"CUB",
Parent = @"Central America",
Name = @"Cuba",
Population = 11253665
});
this.Add(new CountyHierarchicalDataItem()
{
Code = @"CUR",
Parent = @"Central America",
Name = @"Curacao",
Population = 145619
});
this.Add(new CountyHierarchicalDataItem()
{
Code = @"DMA",
Parent = @"Central America",
Name = @"Dominica",
Population = 67675
});
this.Add(new CountyHierarchicalDataItem()
{
Code = @"DOM",
Parent = @"Central America",
Name = @"Dominican Republic",
Population = 10056181
});
this.Add(new CountyHierarchicalDataItem()
{
Code = @"SLV",
Parent = @"Central America",
Name = @"El Salvador",
Population = 6227491
});
this.Add(new CountyHierarchicalDataItem()
{
Code = @"FIS",
Parent = @"Central America",
Name = @"Faeroe Islands",
Population = 48863
});
this.Add(new CountyHierarchicalDataItem()
{
Code = @"GND",
Parent = @"Central America",
Name = @"Grenada",
Population = 104890
});
this.Add(new CountyHierarchicalDataItem()
{
Code = @"GUA",
Parent = @"Central America",
Name = @"Guam",
Population = 182111
});
this.Add(new CountyHierarchicalDataItem()
{
Code = @"GTM",
Parent = @"Central America",
Name = @"Guatemala",
Population = 14757316
});
this.Add(new CountyHierarchicalDataItem()
{
Code = @"HAT",
Parent = @"Central America",
Name = @"Haiti",
Population = 10123787
});
this.Add(new CountyHierarchicalDataItem()
{
Code = @"HON",
Parent = @"Central America",
Name = @"Honduras",
Population = 7754687
});
this.Add(new CountyHierarchicalDataItem()
{
Code = @"JAM",
Parent = @"Central America",
Name = @"Jamaica",
Population = 2706500
});
this.Add(new CountyHierarchicalDataItem()
{
Code = @"NCR",
Parent = @"Central America",
Name = @"Nicaragua",
Population = 5869859
});
this.Add(new CountyHierarchicalDataItem()
{
Code = @"NMI",
Parent = @"Central America",
Name = @"Northern Mariana Islands",
Population = 61174
});
this.Add(new CountyHierarchicalDataItem()
{
Code = @"PAN",
Parent = @"Central America",
Name = @"Panama",
Population = 3571185
});
this.Add(new CountyHierarchicalDataItem()
{
Code = @"PRT",
Parent = @"Central America",
Name = @"Puerto Rico",
Population = 3706690
});
this.Add(new CountyHierarchicalDataItem()
{
Code = @"STK",
Parent = @"Central America",
Name = @"St. Kitts",
Population = 53051
});
this.Add(new CountyHierarchicalDataItem()
{
Code = @"STL",
Parent = @"Central America",
Name = @"St. Lucia",
Population = 176000
});
this.Add(new CountyHierarchicalDataItem()
{
Code = @"STV",
Parent = @"Central America",
Name = @"St. Vincent",
Population = 109365
});
this.Add(new CountyHierarchicalDataItem()
{
Code = @"TAB",
Parent = @"Central America",
Name = @"Trinidad and Tobago",
Population = 1346350
});
this.Add(new CountyHierarchicalDataItem()
{
Code = @"RCI",
Parent = @"Central America",
Name = @"Turks and Caicos Islands",
Population = 39184
});
this.Add(new CountyHierarchicalDataItem()
{
Code = @"ISV",
Parent = @"Central America",
Name = @"US Virgin Islands",
Population = 109666
});
this.Add(new CountyHierarchicalDataItem()
{
Code = @"ALB",
Parent = @"Europe",
Name = @"Albania",
Population = 3215988
});
this.Add(new CountyHierarchicalDataItem()
{
Code = @"AND",
Parent = @"Europe",
Name = @"Andorra",
Population = 86165
});
this.Add(new CountyHierarchicalDataItem()
{
Code = @"ARM",
Parent = @"Europe",
Name = @"Armenia",
Population = 3100236
});
this.Add(new CountyHierarchicalDataItem()
{
Code = @"AUT",
Parent = @"Europe",
Name = @"Austria",
Population = 8423635
});
this.Add(new CountyHierarchicalDataItem()
{
Code = @"BER",
Parent = @"Europe",
Name = @"Belarus",
Population = 9473000
});
this.Add(new CountyHierarchicalDataItem()
{
Code = @"BEL",
Parent = @"Europe",
Name = @"Belgium",
Population = 11020952
});
this.Add(new CountyHierarchicalDataItem()
{
Code = @"BIH",
Parent = @"Europe",
Name = @"Bosnia",
Population = 3752228
});
this.Add(new CountyHierarchicalDataItem()
{
Code = @"BUL",
Parent = @"Europe",
Name = @"Bulgaria",
Population = 7348328
});
this.Add(new CountyHierarchicalDataItem()
{
Code = @"CHI",
Parent = @"Europe",
Name = @"Channel Islands",
Population = 153876
});
this.Add(new CountyHierarchicalDataItem()
{
Code = @"CRO",
Parent = @"Europe",
Name = @"Croatia",
Population = 4403000
});
this.Add(new CountyHierarchicalDataItem()
{
Code = @"CYP",
Parent = @"Europe",
Name = @"Cyprus",
Population = 1116564
});
this.Add(new CountyHierarchicalDataItem()
{
Code = @"CZE",
Parent = @"Europe",
Name = @"Czechia",
Population = 10496088
});
this.Add(new CountyHierarchicalDataItem()
{
Code = @"DEN",
Parent = @"Europe",
Name = @"Denmark",
Population = 5570572
});
this.Add(new CountyHierarchicalDataItem()
{
Code = @"EST",
Parent = @"Europe",
Name = @"Estonia",
Population = 1339928
});
this.Add(new CountyHierarchicalDataItem()
{
Code = @"FIN",
Parent = @"Europe",
Name = @"Finland",
Population = 5388272
});
this.Add(new CountyHierarchicalDataItem()
{
Code = @"FRA",
Parent = @"Europe",
Name = @"France",
Population = 65433714
});
this.Add(new CountyHierarchicalDataItem()
{
Code = @"GEO",
Parent = @"Europe",
Name = @"Georgia",
Population = 4486000
});
this.Add(new CountyHierarchicalDataItem()
{
Code = @"DEU",
Parent = @"Europe",
Name = @"Germany",
Population = 81797673
});
this.Add(new CountyHierarchicalDataItem()
{
Code = @"GRC",
Parent = @"Europe",
Name = @"Greece",
Population = 11300410
});
this.Add(new CountyHierarchicalDataItem()
{
Code = @"HUN",
Parent = @"Europe",
Name = @"Hungary",
Population = 9971727
});
this.Add(new CountyHierarchicalDataItem()
{
Code = @"ICE",
Parent = @"Europe",
Name = @"Iceland",
Population = 319014
});
this.Add(new CountyHierarchicalDataItem()
{
Code = @"IRE",
Parent = @"Europe",
Name = @"Ireland",
Population = 4576317
});
this.Add(new CountyHierarchicalDataItem()
{
Code = @"IOM",
Parent = @"Europe",
Name = @"Isle of Man",
Population = 83327
});
this.Add(new CountyHierarchicalDataItem()
{
Code = @"ITA",
Parent = @"Europe",
Name = @"Italy",
Population = 60723603
});
this.Add(new CountyHierarchicalDataItem()
{
Code = @"KOS",
Parent = @"Europe",
Name = @"Kosovo",
Population = 1802765
});
this.Add(new CountyHierarchicalDataItem()
{
Code = @"LAT",
Parent = @"Europe",
Name = @"Latvia",
Population = 2058184
});
this.Add(new CountyHierarchicalDataItem()
{
Code = @"LVA",
Parent = @"Europe",
Name = @"Liechtenstein",
Population = 36304
});
this.Add(new CountyHierarchicalDataItem()
{
Code = @"LTU",
Parent = @"Europe",
Name = @"Lithuania",
Population = 3030173
});
this.Add(new CountyHierarchicalDataItem()
{
Code = @"LUX",
Parent = @"Europe",
Name = @"Luxembourg",
Population = 518252
});
this.Add(new CountyHierarchicalDataItem()
{
Code = @"MKD",
Parent = @"Europe",
Name = @"North Macedonia",
Population = 2063893
});
this.Add(new CountyHierarchicalDataItem()
{
Code = @"MLT",
Parent = @"Europe",
Name = @"Malta",
Population = 415654
});
this.Add(new CountyHierarchicalDataItem()
{
Code = @"MDA",
Parent = @"Europe",
Name = @"Moldova",
Population = 3559000
});
this.Add(new CountyHierarchicalDataItem()
{
Code = @"MON",
Parent = @"Europe",
Name = @"Monaco",
Population = 35427
});
this.Add(new CountyHierarchicalDataItem()
{
Code = @"MNE",
Parent = @"Europe",
Name = @"Montenegro",
Population = 632261
});
this.Add(new CountyHierarchicalDataItem()
{
Code = @"MLD",
Parent = @"Europe",
Name = @"Netherlands",
Population = 16693074
});
this.Add(new CountyHierarchicalDataItem()
{
Code = @"NOR",
Parent = @"Europe",
Name = @"Norway",
Population = 4953088
});
this.Add(new CountyHierarchicalDataItem()
{
Code = @"POL",
Parent = @"Europe",
Name = @"Poland",
Population = 38534157
});
this.Add(new CountyHierarchicalDataItem()
{
Code = @"POR",
Parent = @"Europe",
Name = @"Portugal",
Population = 10556999
});
this.Add(new CountyHierarchicalDataItem()
{
Code = @"ROM",
Parent = @"Europe",
Name = @"Romania",
Population = 21384832
});
this.Add(new CountyHierarchicalDataItem()
{
Code = @"RUS",
Parent = @"Europe",
Name = @"Russia",
Population = 142960000
});
this.Add(new CountyHierarchicalDataItem()
{
Code = @"SMR",
Parent = @"Europe",
Name = @"San Marino",
Population = 31735
});
this.Add(new CountyHierarchicalDataItem()
{
Code = @"SBR",
Parent = @"Europe",
Name = @"Serbia",
Population = 7258745
});
this.Add(new CountyHierarchicalDataItem()
{
Code = @"STM",
Parent = @"Europe",
Name = @"Sint Maarten",
Population = 36609
});
this.Add(new CountyHierarchicalDataItem()
{
Code = @"SVK",
Parent = @"Europe",
Name = @"Slovakia",
Population = 5398384
});
this.Add(new CountyHierarchicalDataItem()
{
Code = @"SLO",
Parent = @"Europe",
Name = @"Slovenia",
Population = 2052843
});
this.Add(new CountyHierarchicalDataItem()
{
Code = @"ESP",
Parent = @"Europe",
Name = @"Spain",
Population = 46174601
});
this.Add(new CountyHierarchicalDataItem()
{
Code = @"STM",
Parent = @"Europe",
Name = @"St. Martin",
Population = 30615
});
this.Add(new CountyHierarchicalDataItem()
{
Code = @"SWE",
Parent = @"Europe",
Name = @"Sweden",
Population = 9449213
});
this.Add(new CountyHierarchicalDataItem()
{
Code = @"CHE",
Parent = @"Europe",
Name = @"Switzerland",
Population = 7912398
});
this.Add(new CountyHierarchicalDataItem()
{
Code = @"UKR",
Parent = @"Europe",
Name = @"Ukraine",
Population = 45706100
});
this.Add(new CountyHierarchicalDataItem()
{
Code = @"GBR",
Parent = @"Europe",
Name = @"United Kingdom",
Population = 62744081
});
this.Add(new CountyHierarchicalDataItem()
{
Code = @"DZA",
Parent = @"Middle East",
Name = @"Algeria",
Population = 35980193
});
this.Add(new CountyHierarchicalDataItem()
{
Code = @"AZE",
Parent = @"Middle East",
Name = @"Azerbaijan",
Population = 9173082
});
this.Add(new CountyHierarchicalDataItem()
{
Code = @"BHR",
Parent = @"Middle East",
Name = @"Bahrain",
Population = 1323535
});
this.Add(new CountyHierarchicalDataItem()
{
Code = @"EGY",
Parent = @"Middle East",
Name = @"Egypt",
Population = 82536770
});
this.Add(new CountyHierarchicalDataItem()
{
Code = @"IRN",
Parent = @"Middle East",
Name = @"Iran",
Population = 74798599
});
this.Add(new CountyHierarchicalDataItem()
{
Code = @"IRQ",
Parent = @"Middle East",
Name = @"Iraq",
Population = 32961959
});
this.Add(new CountyHierarchicalDataItem()
{
Code = @"ISR",
Parent = @"Middle East",
Name = @"Israel",
Population = 7765900
});
this.Add(new CountyHierarchicalDataItem()
{
Code = @"JOR",
Parent = @"Middle East",
Name = @"Jordan",
Population = 6181000
});
this.Add(new CountyHierarchicalDataItem()
{
Code = @"KWT",
Parent = @"Middle East",
Name = @"Kuwait",
Population = 2818042
});
this.Add(new CountyHierarchicalDataItem()
{
Code = @"LBN",
Parent = @"Middle East",
Name = @"Lebanon",
Population = 4259405
});
this.Add(new CountyHierarchicalDataItem()
{
Code = @"LBY",
Parent = @"Middle East",
Name = @"Libya",
Population = 6422772
});
this.Add(new CountyHierarchicalDataItem()
{
Code = @"MAR",
Parent = @"Middle East",
Name = @"Morocco",
Population = 32272974
});
this.Add(new CountyHierarchicalDataItem()
{
Code = @"OMN",
Parent = @"Middle East",
Name = @"Oman",
Population = 2846145
});
this.Add(new CountyHierarchicalDataItem()
{
Code = @"PKS",
Parent = @"Middle East",
Name = @"Pakistan",
Population = 176745364
});
this.Add(new CountyHierarchicalDataItem()
{
Code = @"QTR",
Parent = @"Middle East",
Name = @"Qatar",
Population = 1870041
});
this.Add(new CountyHierarchicalDataItem()
{
Code = @"SAR",
Parent = @"Middle East",
Name = @"Saudi Arabia",
Population = 28082541
});
this.Add(new CountyHierarchicalDataItem()
{
Code = @"SOM",
Parent = @"Middle East",
Name = @"Somalia",
Population = 9556873
});
this.Add(new CountyHierarchicalDataItem()
{
Code = @"SYR",
Parent = @"Middle East",
Name = @"Syria",
Population = 20820311
});
this.Add(new CountyHierarchicalDataItem()
{
Code = @"TUN",
Parent = @"Middle East",
Name = @"Tunisia",
Population = 10673800
});
this.Add(new CountyHierarchicalDataItem()
{
Code = @"TUR",
Parent = @"Middle East",
Name = @"Turkey",
Population = 73639596
});
this.Add(new CountyHierarchicalDataItem()
{
Code = @"UAE",
Parent = @"Middle East",
Name = @"United Arab Emirates",
Population = 7890924
});
this.Add(new CountyHierarchicalDataItem()
{
Code = @"WTB",
Parent = @"Middle East",
Name = @"West Bank",
Population = 3927051
});
this.Add(new CountyHierarchicalDataItem()
{
Code = @"YEM",
Parent = @"Middle East",
Name = @"Yemen",
Population = 24799880
});
this.Add(new CountyHierarchicalDataItem()
{
Code = @"CAN",
Parent = @"North America",
Name = @"Canada",
Population = 34483975
});
this.Add(new CountyHierarchicalDataItem()
{
Code = @"GRL",
Parent = @"North America",
Name = @"Greenland",
Population = 56840
});
this.Add(new CountyHierarchicalDataItem()
{
Code = @"MEX",
Parent = @"North America",
Name = @"Mexico",
Population = 114793341
});
this.Add(new CountyHierarchicalDataItem()
{
Code = @"USA",
Parent = @"North America",
Name = @"United States",
Population = 311591917
});
this.Add(new CountyHierarchicalDataItem()
{
Code = @"AMS",
Parent = @"Oceania",
Name = @"American Samoa",
Population = 69543
});
this.Add(new CountyHierarchicalDataItem()
{
Code = @"AUS",
Parent = @"Oceania",
Name = @"Australia",
Population = 22323900
});
this.Add(new CountyHierarchicalDataItem()
{
Code = @"FIJ",
Parent = @"Oceania",
Name = @"Fiji",
Population = 868406
});
this.Add(new CountyHierarchicalDataItem()
{
Code = @"FRP",
Parent = @"Oceania",
Name = @"French Polynesia",
Population = 273777
});
this.Add(new CountyHierarchicalDataItem()
{
Code = @"KIR",
Parent = @"Oceania",
Name = @"Kiribati",
Population = 101093
});
this.Add(new CountyHierarchicalDataItem()
{
Code = @"MIS",
Parent = @"Oceania",
Name = @"Marshall Islands",
Population = 54816
});
this.Add(new CountyHierarchicalDataItem()
{
Code = @"MCR",
Parent = @"Oceania",
Name = @"Micronesia",
Population = 111542
});
this.Add(new CountyHierarchicalDataItem()
{
Code = @"NCD",
Parent = @"Oceania",
Name = @"New Caledonia",
Population = 254024
});
this.Add(new CountyHierarchicalDataItem()
{
Code = @"NZL",
Parent = @"Oceania",
Name = @"New Zealand",
Population = 4405200
});
this.Add(new CountyHierarchicalDataItem()
{
Code = @"PAL",
Parent = @"Oceania",
Name = @"Palau",
Population = 20609
});
this.Add(new CountyHierarchicalDataItem()
{
Code = @"PNG",
Parent = @"Oceania",
Name = @"Papua New Guinea",
Population = 7013829
});
this.Add(new CountyHierarchicalDataItem()
{
Code = @"SAM",
Parent = @"Oceania",
Name = @"Samoa",
Population = 183874
});
this.Add(new CountyHierarchicalDataItem()
{
Code = @"SIS",
Parent = @"Oceania",
Name = @"Solomon Islands",
Population = 552267
});
this.Add(new CountyHierarchicalDataItem()
{
Code = @"TML",
Parent = @"Oceania",
Name = @"Timor-Leste",
Population = 1175880
});
this.Add(new CountyHierarchicalDataItem()
{
Code = @"TON",
Parent = @"Oceania",
Name = @"Tonga",
Population = 104509
});
this.Add(new CountyHierarchicalDataItem()
{
Code = @"TUV",
Parent = @"Oceania",
Name = @"Tuvalu",
Population = 9847
});
this.Add(new CountyHierarchicalDataItem()
{
Code = @"VNT",
Parent = @"Oceania",
Name = @"Vanuatu",
Population = 245619
});
this.Add(new CountyHierarchicalDataItem()
{
Code = @"ARG",
Parent = @"South America",
Name = @"Argentina",
Population = 40764561
});
this.Add(new CountyHierarchicalDataItem()
{
Code = @"BOL",
Parent = @"South America",
Name = @"Bolivia",
Population = 10088108
});
this.Add(new CountyHierarchicalDataItem()
{
Code = @"BRA",
Parent = @"South America",
Name = @"Brazil",
Population = 196655014
});
this.Add(new CountyHierarchicalDataItem()
{
Code = @"CHI",
Parent = @"South America",
Name = @"Chile",
Population = 17269525
});
this.Add(new CountyHierarchicalDataItem()
{
Code = @"COL",
Parent = @"South America",
Name = @"Colombia",
Population = 46927125
});
this.Add(new CountyHierarchicalDataItem()
{
Code = @"ECU",
Parent = @"South America",
Name = @"Ecuador",
Population = 14666055
});
this.Add(new CountyHierarchicalDataItem()
{
Code = @"GUY",
Parent = @"South America",
Name = @"Guyana",
Population = 756040
});
this.Add(new CountyHierarchicalDataItem()
{
Code = @"PAR",
Parent = @"South America",
Name = @"Paraguay",
Population = 6568290
});
this.Add(new CountyHierarchicalDataItem()
{
Code = @"PER",
Parent = @"South America",
Name = @"Peru",
Population = 29399817
});
this.Add(new CountyHierarchicalDataItem()
{
Code = @"SUR",
Parent = @"South America",
Name = @"Suriname",
Population = 529419
});
this.Add(new CountyHierarchicalDataItem()
{
Code = @"URG",
Parent = @"South America",
Name = @"Uruguay",
Population = 3368595
});
this.Add(new CountyHierarchicalDataItem()
{
Code = @"VEN",
Parent = @"South America",
Name = @"Venezuela",
Population = 29278000
});
}
}
csusing System;
using System.Net.Http;
using System.Collections.Generic;
using System.Threading.Tasks;
using System.Text;
using Microsoft.AspNetCore.Components.WebAssembly.Hosting;
using Microsoft.Extensions.Configuration;
using Microsoft.Extensions.DependencyInjection;
using Microsoft.Extensions.Logging;
using IgniteUI.Blazor.Controls; // for registering Ignite UI modules
namespace Infragistics.Samples
{
public class Program
{
public static async Task Main(string[] args)
{
var builder = WebAssemblyHostBuilder.CreateDefault(args);
builder.RootComponents.Add<App>("app");
builder.Services.AddScoped(sp => new HttpClient { BaseAddress = new Uri(builder.HostEnvironment.BaseAddress) });
// registering Ignite UI modules
builder.Services.AddIgniteUIBlazor(
typeof(IgbTreemapModule)
);
await builder.Build().RunAsync();
}
}
}
cs
@using IgniteUI.Blazor.Controls
<div class="container vertical">
<div class="legend-title">
Comparing Population of Countries
</div>
<div class="container vertical fill">
<IgbTreemap
Name="treemap"
@ref="treemap"
DataSource="CountyHierarchicalData"
ParentIdMemberPath="Parent"
IdMemberPath="Name"
LabelMemberPath="Name"
ValueMemberPath="Population"
FillScaleMode="TreemapFillScaleMode.Value"
FillScaleMinimumValue="0"
FillScaleMaximumValue="1500000000"
FillBrushes="#4e62cf #8a58d6"
IsFillScaleLogarithmic="true"
RootTitle="Countries"
HeaderDisplayMode="TreemapHeaderDisplayMode.Overlay"
ParentNodeBottomPadding="0"
ParentNodeLeftPadding="0"
ParentNodeRightPadding="0"
ParentNodeTopPadding="0"
Outline="black"
StrokeThickness="1">
</IgbTreemap>
</div>
</div>
@code {
protected override async Task OnAfterRenderAsync(bool firstRender)
{
var treemap = this.treemap;
}
private IgbTreemap treemap;
private CountyHierarchicalData _countyHierarchicalData = null;
public CountyHierarchicalData CountyHierarchicalData
{
get
{
if (_countyHierarchicalData == null)
{
_countyHierarchicalData = new CountyHierarchicalData();
}
return _countyHierarchicalData;
}
}
}
razor/*
CSS styles are loaded from the shared CSS file located at:
https://static.infragistics.com/xplatform/css/samples/
*/
css
Blazor チャート主な機能
組み込みの時間軸を使用して、データが時間の経過とともにどのように変化するかを示します。チャートを操作すると、時間スケールとラベル書式が動的に変更されます。YahooFinance や GoogleFinance など、ファイナンシャル チャートに期待されるすべての機能を備えた完全なファイナンシャル チャートが含まれています。
動的なチャート
新しい複合チャートを作成し、単一のチャートで複数のシリーズを重ね合わせて、データを視覚化します。チャートでは、複数のチャート列を表示および重ねて、積層型縦棒を作成できます。
カスタム ツールチップ
新しい複合ビューを作成し、単一のチャートで複数のシリーズを重ね合わせて、データを視覚化します。チャートでは、画像やデータ バインディングを使用してカスタム ツールチップを作成したり、複数のシリーズのツールチップを 1 つのツールチップに組み合わせたりすることもできます。
リアルタイムの高パフォーマンスなチャート
ライブのストリーミング データを使用して、ミリ秒レベルの更新で数千のデータ ポイントをリアルタイムで表示します。タッチ デバイスでチャートを操作しているときでも、ラグ、画面のちらつき、表示の遅れは発生しません。デモについては、高頻度のチャートトピックを参照してください。
大量のデータ処理
チャート パフォーマンスを最適化して、エンドユーザーがチャートのコンテンツをズームイン/ズームアウトまたはナビゲートしようとしたときにスムーズなパフォーマンスを提供し続けながら、数百万のデータ ポイントを描画します。デモについては、大量データのチャートトピックを参照してください。
モジュラー デザイン
Blazorチャート は、モジュール性のために設計されています。必要な機能のみが展開一部であるため、描画されたページで可能な限り最小のフットプリントを取得します。
スマート データ バインディング
チャート タイプの選択はお任せください。当社のスマート データ アダプタは、データに最適なチャート タイプを自動的に選択します。データ ソースを設定するだけです。
トレンドライン
Blazor チャートは、線形 (x)、二次 (x2)、三次 (x3)、四次 (x4)、五次 (x5)、対数 (logn x)、指数 (ex)、べき乗 (axk + o(xk)) など、必要になるすべてのトレンドラインをサポートします。
インタラクティブなパニングとズーム
シングル タッチまたはマルチタッチ、キーボード、ズーム バー、マウス ホイールを使用し、マウスで任意の長方形領域をドラッグ選択してズームインし、データ ポイントのクローズアップ、データ履歴のスクロール、またはデータ領域のパンを行います。
マーカー、ツールチップ、およびテンプレート
10 個のマーカー タイプのいずれかを使用するか、独自のマーカー-テンプレートを作成して、データをハイライト表示するか、シンプルなツールチップまたはカスタム ツールチップを使用した多軸および複数系列のチャートで、データにコンテキストと意味を追加します。
その他の詳細
他の Blazor チャートを検討している場合は、次のことを考慮しましょう:
- 65 を超える Blazor チャート タイプと複合チャートが含まれており、スマート データ アダプタを使用した類を見ない最も簡単な構成が可能です。
- チャートは、Angular、Blazor、jQuery / JavaScript、React、UNO、UWP、WPF、Windows Forms、WebComponents、WinUI、Xamarin などのすべてのプラットフォームで最適化されています。すべてのプラットフォームで同じ API と機能をサポートします。
- 当社の株価チャートとファイナンシャル チャートは、YahooFinance または Google Finance のようなエクスペリエンスに必要なすべてを 1 行のコードで提供します。
- Ignite UI for Angular は、Angular 開発者向けの Angular 上に構築されており、サードパーティの依存関係はありません。Angular 用に 100% 最適化されています。
- 他社のパフォーマンスに対してテストします。当社は高速で大量のデータを処理できることを証明できます。大量のデータとリアルタイムのデータ ストリーミングをどのように処理するかをご自身で確認してください。
- 24/5 対応しております。インフラジスティックスは、常にオンラインでグローバル サポートを提供しています。北米、アジア太平洋、中東、およびヨーロッパでは、いつでもご利用いただけます。
- チャートの他に、Blazor には多くの UI コントロールもあります。アプリケーション構築のための完全な Blazor ソリューションを提供します!
API リファレンス
このトピックで言及されているすべてのチャート タイプは、次の API コンポーネントに実装されています: