Xamarin Sparkline Chart
The Sparkline control is a data-intense, design-simple graphic that allows end users to spot trends, variations, and data patterns in a clear and compact representation. It is intended for rendering in a small-scale layout such as a grid cell, but can also be rendered as a standalone control.
Chart Types
The Sparkline control supports four different chart types for presenting data: Area, Column, Line, and WinLoss.
Area
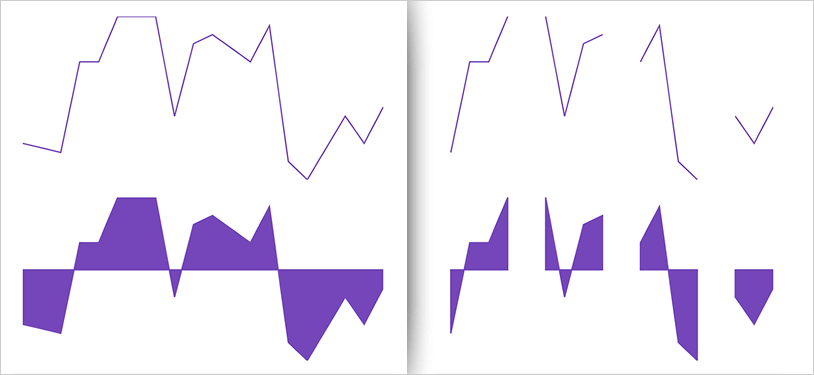
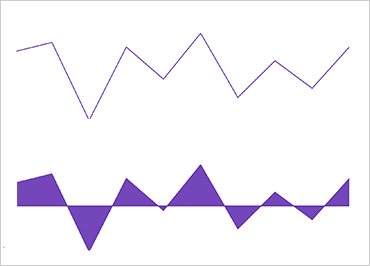
Displays the Area chart type of Sparkline with numeric data. This is similar to a Line chart type, with the additional step of closing the area after each line is drawn.
Column
Displays the Column chart type of Sparkline with numeric data. Some may refer to it as this as Vertical Bars.
Line
Displays the Line chart type of Sparkline with numeric data, connecting the data points with line segments.
WinLoss
This type is visually similar to the Column chart type, in which the value of each column is equal to either the positive maximum (for positive values) or the negative minimum (for negative value) of the data set. The idea is to indicate a win or a loss scenario.
Trend Lines
Trend lines are lines drawn from the starting point to the end point of the chart data, indicating the trending direction and movement of the series, so that the viewer can evaluate the tendencies in the data and mentally extrapolate past, future, or unknown values. The Trend Line feature enables you to choose among several formulas for generating a trending directional line, including linear, weighted, quadratic, cubic, quartic, quintic, logarithmic, exponential, and more.
Markers
Markers are symbols overlaid on a single data point to indicate the individual data points plotted on the chart, based on the X/Y coordinates. The Sparkline can display markers such as First/Last, High/Low, Negative, or all markers.
Interpolating Unknown Values
The Sparkline can detect unknown values and render the space for the unknown values using a specified interpolation algorithm.