Xamarinデータ チャート
Xamarinデータ チャートコントロールを使用すると、データを複数のシリーズとタイプで表示したり、アニメーション化されたトランジションを使用したり、凡例、軸、マーカー、シリーズ、トレンドライン、インタラクションレイヤーのモジュラーデザイン機能を使用したりできます。
Visual Studio Marketplace で、最新の更新プログラムが適用されていることを確認してください。
アニメーション化されたトランジション
アニメーション化されたデータポイントの動きと方向に基づいて、18の異なるアニメーション化された入口トランジションから選択します。トランジションには、側面または軸からのアコーディオン、値の中点からの拡張、ゼロ値または参照値、側面または軸からのスイープなどがあります。表示されたら、イージング機能付きのトランジションを追加して、データに命を吹き込むこともできます。

財務シリーズ
ローソク足とOHLCの両方の棒グラフ、および移動平均、ボリンジャーバンド、マネーフローインデックス、MACD、ワイルダーRSIなどの組み込みテクニカル指標のサポートにより、財務チャートのシナリオを制御できます。

散布図シリーズ
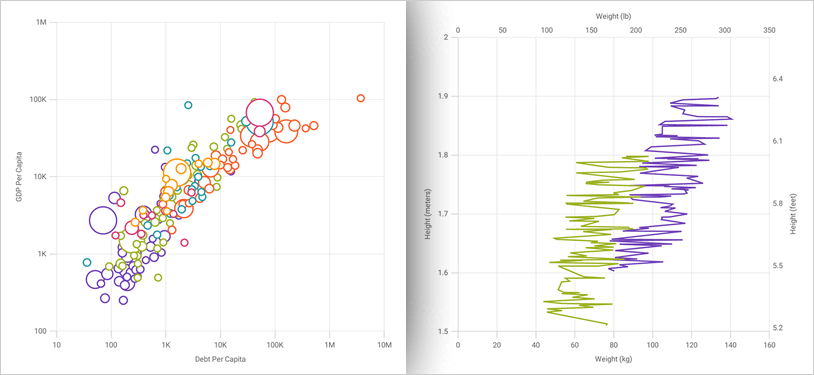
科学グラフを作成して、個別のデータセット内のアイテム間の関係を示すか、x 座標と y 座標を使用してデータアイテムをプロットします。散布図シリーズを使用すると、不均一な間隔やデータのクラスターに注意を引くことができ、収集されたデータの予測結果からの偏差を強調表示できます。散布図シリーズを使用すると、データが時系列に並んでいない場合でも、データを時系列に整理できます。
極座標シリーズ
独自の極座標チャートを作成し、デカルト座標系 (X, Y) ではなく極座標 (角度、半径) 座標系でデータをプロットして、風向と風速、磁場の強さと方向、太陽系のオブジェクトの位置などの方向コンポーネントを持つ個別のデータセット内のアイテム間の関係を示します。

ラジアル シリーズ
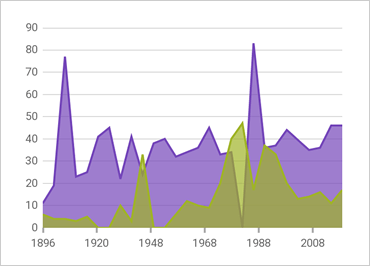
放射状チャートを作成して、標準 (x, y) 座標系でデータをプロットするのではなく、中心または外側に向かってデータ値の拡張を表示します。これらのグラフシリーズを使用して、財務データを新しく興味深い方法で表示および比較します。

軸の注釈
各値オーバーレイに注釈を追加し、すべてのチャートレイヤーの背景、前景、アウトライン、およびストロークの太さをカスタマイズします。これにより、重要な傾向やデータポイントを強調し、明確に視覚化することができます。
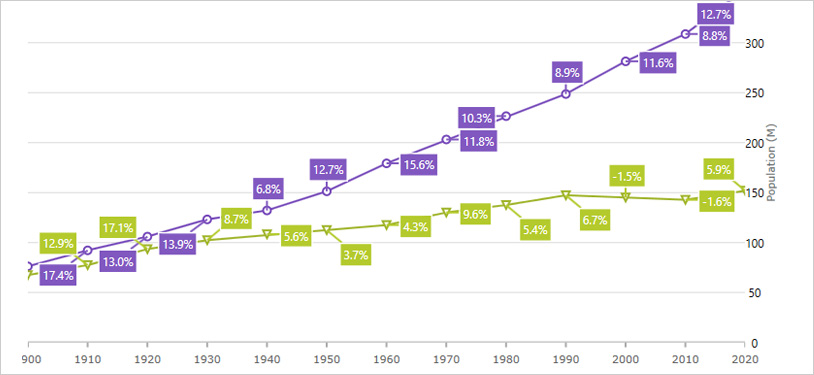
コールアウト レイヤー
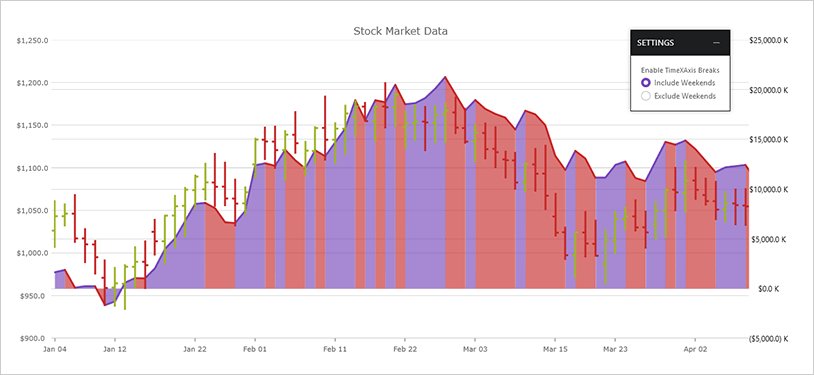
重要なデータポイントに注釈を付けたり、その値を表示したりします。コールアウトレイヤーは、複数のデータシリーズまたは個々のデータシリーズをターゲットにすることができます。また、これらの吹出しレイヤーの外観をカスタマイズしたり、吹出しラベルをデータ項目にバインドしたり、連続するデータポイント間の変化を計算したりすることもできます。
最終値レイヤー
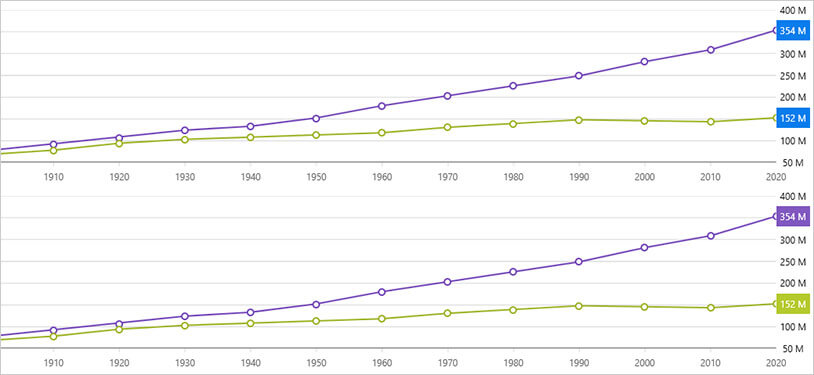
このアノテーションレイヤーは、データソース内の最後のデータポイントの値を示します。注釈は、Y-Axis ラベル上の各データ ソースの色付きのボックスとしてレンダリングされます。
