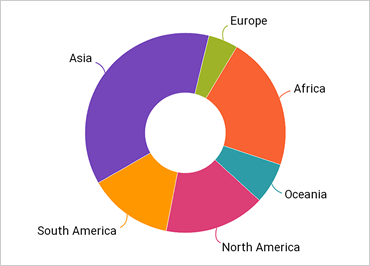
Xamarinドーナツ チャート
Xamarinドーナツ チャートは、同心円のリングを使用して複数のシリーズを表示し、各シリーズはデータシリーズを表します。円チャートと同様に、ドーナツ チャートはパーセンテージで表されるカテゴリ統計を示します。中空の中心の境界を簡単に構成でき、空のままにすることも、ラベルを付けることもできます。データに簡単にバインドしたり、分解されたスライスを表示したり、テーマをカスタマイズしたり、この充実したコントロールを使用して行うことができます。
詳細はこちら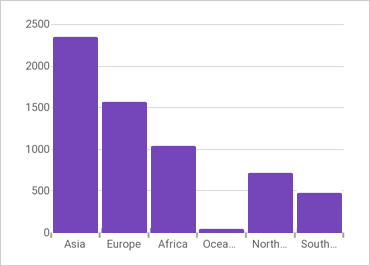
Xamarinカテゴリ チャート
このタッチ対応のグラフ作成コントロールにより、カテゴリベースのデータを簡単に視覚化できます。業界最高のパフォーマンスを発揮し、機能豊富なデータチャート上に構築されたカテゴリチャートは、データビジュアライゼーションの複雑さをフィルタリングして、誰でも使用できるシンプルなAPIにします。
詳細はこちら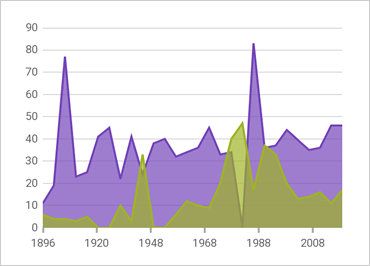
Xamarinデータ チャート
Xamarinデータ チャートコントロールを使用すると、データを複数のシリーズとタイプで表示したり、アニメーション化されたトランジションを使用したり、凡例、軸、マーカー、シリーズ、トレンドライン、インタラクションレイヤーのモジュラーデザイン機能を使用したりできます。
詳細はこちら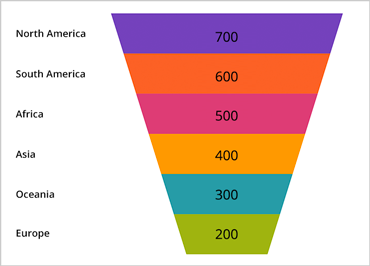
Xamarinファンネル チャート
新しいファンネル チャートコントロールは、データをさまざまな数のセクションを持つじょうご状に表示し、それぞれが 100% の異なる部分としてデータを表す単一シリーズ グラフです。ファネルチャートを使用すると、エンドユーザーは、販売プロセスにおける価値の「フォールアウト」や、マルチステッププロセスの流れにおけるボトルネックを簡単に説明できます。
じょうごグラフは、円グラフのように、数量を全体のパーセンテージとして表示します。ファネルチャートは、プロセスのステージに関連する定量的データを表示するために一般的に使用されます。たとえば、ファネル グラフには、製造段階からその製品の実際の販売までの製品の費用が表示される場合があります。
詳細はこちら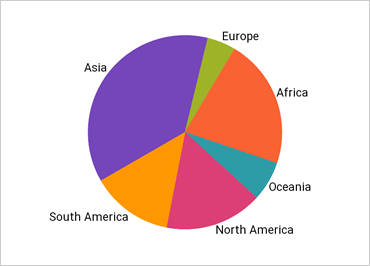
Xamarin円チャート
円チャートコントロールを使用して、タップ ジェスチャでドリルダウンしたり、基になるデータを表示したり、円グラフ セクションを分解したりします。「その他」カテゴリに含めるためのカスタマイズ可能なしきい値を持つ単純な円グラフまたは分解円グラフを作成します。円の内側または外側にテキスト ラベルを重ならないように表示します。
新しいUltimate UI for Xamarin円チャートConfiguratorを使用すると、XAML から直接コントロールをすばやく構成し、データをバインドできます。コードは必要ありません。
詳細はこちら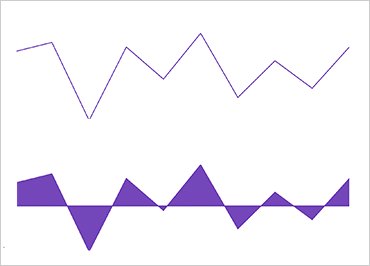
Xamarinスパークラインチャート
スパークライン コントロールは、データ量が多く、デザインがシンプルなグラフィックであり、エンド ユーザーは傾向、バリエーション、データ パターンを明確でコンパクトな表現で見つけることができます。これは、グリッド セルなどの小規模なレイアウトでのレンダリングを目的としていますが、スタンドアロン コントロールとしてレンダリングすることもできます。
詳細はこちら