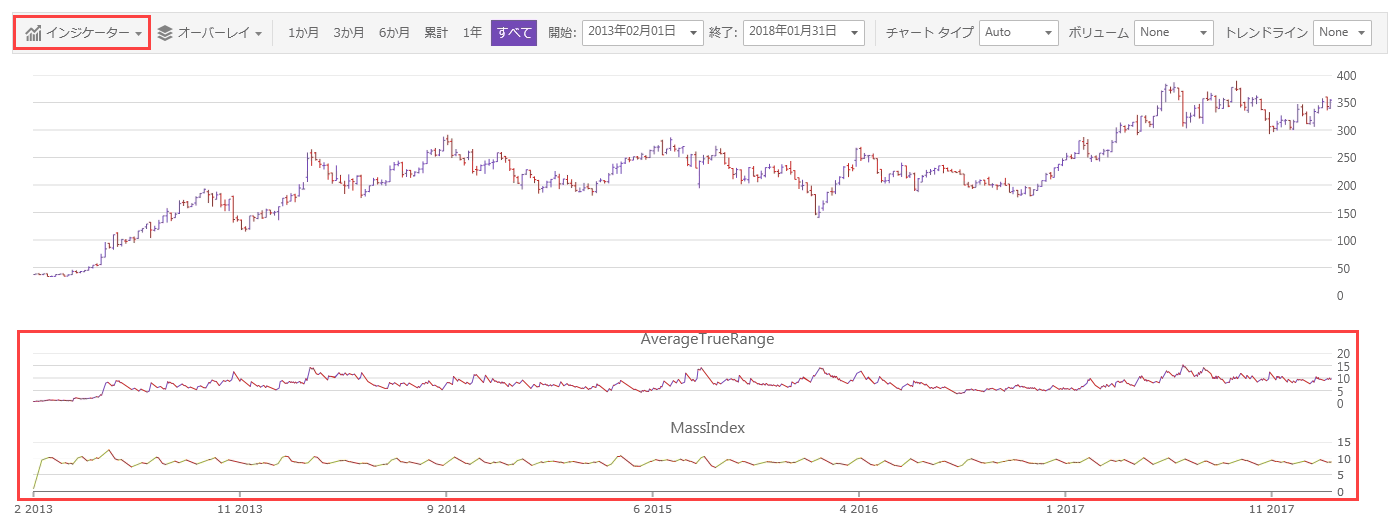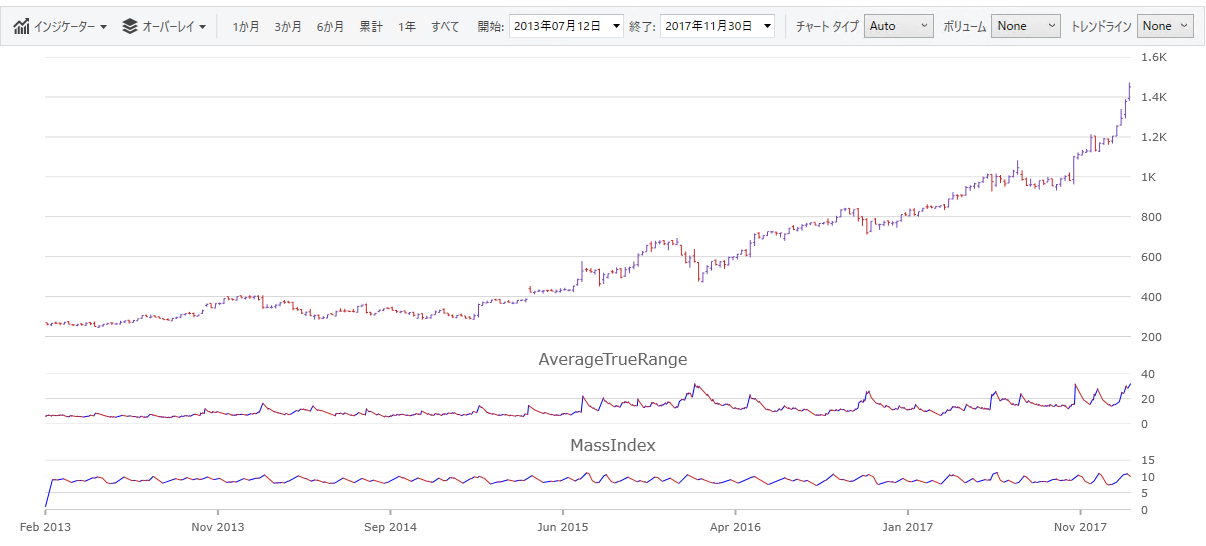
このトピックは、XamFinancialChart コントロールのインジケーター ペインを紹介します。
以下の画面はチャートのインジケーター ペインおよびランタイムにチャート タイプを変更するために使用されるドロップダウンを強調表示します。

既定では、インジケーター ペインは表示されません。インジケーター タイプをコードで設定できます:
XAML の場合:
<ig:XamFinancialChart>
    <ig:XamFinancialChart.IndicatorTypes>
        <ig:FinancialIndicatorTypeCollection>
            <ig:FinancialIndicatorType>AverageTrueRange</ig:FinancialIndicatorType>
            <ig:FinancialIndicatorType>MassIndex</ig:FinancialIndicatorType>
        </ig:FinancialIndicatorTypeCollection>
    </ig:XamFinancialChart.IndicatorTypes>
    <ig:XamFinancialChart.IndicatorDisplayTypes>
        <ig:IndicatorDisplayTypeCollection>
            <ig:IndicatorDisplayType>Area</ig:IndicatorDisplayType>
            <ig:IndicatorDisplayType>Column</ig:IndicatorDisplayType>
        </ig:IndicatorDisplayTypeCollection>
    </ig:XamFinancialChart.IndicatorDisplayTypes>
</ig:XamFinancialChart>
Visual Basic の場合:
Dim chart as New XamFinancialChart()
chart.IndicatorTypes = new FinancialIndicatorTypeCollection()
chart.IndicatorTypes.Add(Infragistics.Controls.Charts.FinancialIndicatorType.AverageTrueRange)
chart.IndicatorTypes.Add(Infragistics.Controls.Charts.FinancialIndicatorType.MassIndex)

chart.IndicatorDisplayTypes = new IndicatorDisplayTypeCollection()
chart.IndicatorDisplayTypes.Add(Infragistics.Controls.Charts.IndicatorDisplayType.Area)
chart.IndicatorDisplayTypes.Add(Infragistics.Controls.Charts.IndicatorDisplayType.Column)
C# の場合:
var chart = new XamFinancialChart();
chart.IndicatorTypes = new FinancialIndicatorTypeCollection();
chart.IndicatorTypes.Add(Infragistics.Controls.Charts.FinancialIndicatorType.AverageTrueRange);
chart.IndicatorTypes.Add(Infragistics.Controls.Charts.FinancialIndicatorType.MassIndex);

chart.IndicatorDisplayTypes = new IndicatorDisplayTypeCollection();
chart.IndicatorDisplayTypes.Add(Infragistics.Controls.Charts.IndicatorDisplayType.Area);
chart.IndicatorDisplayTypes.Add(Infragistics.Controls.Charts.IndicatorDisplayType.Column);XAML の場合:
<ig:XamFinancialChart IndicatorTypes="Area"
    IndicatorBrushes="Blue"
    IndicatorNegativeBrushes="Red"
    IndicatorThickness="2" />
Visual Basic の場合:
Dim chart as New XamFinancialChart()
chart.IndicatorBrushes = New Infragistics.BrushCollection()
Dim brush = As SolidColorBrush = New SolidColorBrush()
brush.Color = Colors.Blue;
chart.IndicatorBrushes.Add(brush)

chart.IndicatorNegativeBrushes = new Infragistics.BrushCollection()
Dim brush2 = As SolidColorBrush = New SolidColorBrush()
brush2.Color = Colors.Red
chart.IndicatorNegativeBrushes.Add(brush2)

chart.IndicatorThickness = 2
C# の場合:
var chart = new XamFinancialChart();
chart.IndicatorBrushes = new Infragistics.BrushCollection();
SolidColorBrush brush = new SolidColorBrush();
brush.Color = Colors.Blue;
chart.IndicatorBrushes.Add(brush);

chart.IndicatorNegativeBrushes = new Infragistics.BrushCollection();
SolidColorBrush brush2 = new SolidColorBrush();
brush2.Color = Colors.Red;
chart.IndicatorNegativeBrushes.Add(brush2);

chart.IndicatorThickness = 2;