<ig:XamFinancialChart x:Name="chart"
    ItemsSource="{Binding}"
    ApplyCustomIndicators="ApplyCustomIndicators" />
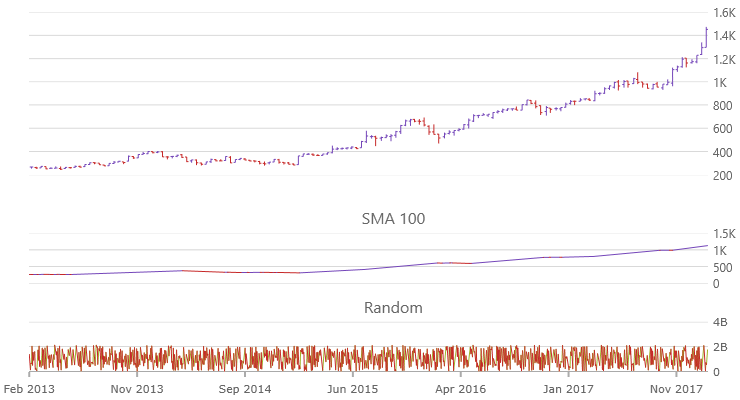
XamFinancialChart コントロールでは、インジケーター ペインに表示するカスタム財務指標を定義できます。
XamFinancialChart でカスタム財務指標を有効にするには、CustomIndicatorNames プロパティに名前を追加し、ApplyCustomIndicators イベントで計算を実行します。
以下のコード例は、2 つのカスタム インジケーターを設定して計算する方法を紹介します。単純移動平均 (SMA) およびランダム値を表示するインジケーターを使用します。
XAML の場合:
<ig:XamFinancialChart x:Name="chart"
ItemsSource="{Binding}"
ApplyCustomIndicators="ApplyCustomIndicators" />C# の場合:
public MainWindow()
{
    InitializeComponent();
    this.DataContext = new ViewModel();

    var names = new ObservableCollection<string>();
    names.Add("SMA 100");
    names.Add("Random");
    chart.CustomIndicatorNames = names;
}

private void ApplyCustomIndicators(object sender, FinancialChartCustomIndicatorArgs e)
{
    var SMAValues = e.IndicatorInfo.SupportingCalculations.SMA.Strategy.Invoke(e.IndicatorInfo.DataSource.CloseColumn, 100);
    int length = e.IndicatorInfo.DataSource.IndicatorColumn.Count;
    switch (e.Index)
    {
        case 0:
            for (int i = 0; i < length; i++)
                e.IndicatorInfo.DataSource.IndicatorColumn[i] = SMAValues.ToList()[i];
            break;
        case 1:
            Random rand = new Random();
            for (int i = 0; i < length; i++)
                e.IndicatorInfo.DataSource.IndicatorColumn[i] = rand.Next();
            break;
    }
}
Visual Basic の場合:
Public Sub New()
    MyBase.New()
    InitializeComponent()
    Me.DataContext = New ViewModel

    Dim names = New ObservableCollection(Of String)
    names.Add("SMA 100")
    names.Add("Random")
    chart.CustomIndicatorNames = names
End Sub

Private Sub ApplyCustomIndicators(ByVal sender As Object, ByVal e As FinancialChartCustomIndicatorArgs)
    Dim SMAValues = e.IndicatorInfo.SupportingCalculations.SMA.Strategy.Invoke(e.IndicatorInfo.DataSource.CloseColumn, 100)
    Dim length As Integer = e.IndicatorInfo.DataSource.IndicatorColumn.Count
    Select Case (e.Index)
        Case 0
            Dim i As Integer = 0
            Do While (i < length)
                e.IndicatorInfo.DataSource.IndicatorColumn(i) = SMAValues.ToList(i)
                i = (i + 1)
            Loop

        Case 1
            Dim rand As Random = New Random
            Dim i As Integer = 0
            Do While (i < length)
                e.IndicatorInfo.DataSource.IndicatorColumn(i) = rand.Next()
                i = (i + 1)
            Loop

    End Select

End Sub