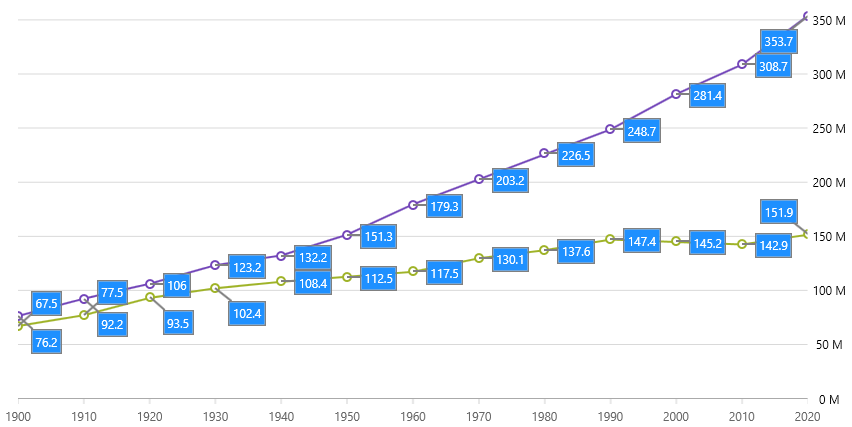
CalloutLayer は XamDataChart コントロールに既存または新しいデータからの注釈を表示します。注釈はデータ ソースのデータ値の横に表示されます。
コールアウト レイヤーは XamDataChart のすべてのシリーズ タイプで使用されることをサポートします。
ユーザーに注目させるデータポイントの詳細またはノートなどの追加情報のためにコールアウト注釈を使用します。
別の構成を持つ複数のコールアウト レイヤーが必要な場合、特別なシリーズを対象とするコールアウトを構成できます。これは TargetSeries プロパティで設定できます。
以下の画像は、CalloutLayer を追加した XamDataChart コントロールのプレビューです。

以下のコードは上記の例を実装します。
XAML の場合:
<ig:XamDataChart x:Name="DataChart" Grid.Column="1"
                 HorizontalZoomable="True"
                 VerticalZoomable="True"
                 DataContext="{StaticResource VM}" >
    <ig:XamDataChart.Axes>
        <ig:CategoryXAxis x:Name="XAxis" ItemsSource="{Binding USA}"
                          Label="{}{Year}"  Interval="1"/>
        <ig:NumericYAxis x:Name="YAxis" MinimumValue="0" Label="{}{} M"
                         Title="{Binding XWDC_WorldData_Types_Population, Source={StaticResource Strings}}">
            <ig:NumericYAxis.LabelSettings>
                <ig:AxisLabelSettings Location="OutsideRight" Margin="5 0 5 0" />
            </ig:NumericYAxis.LabelSettings>
        </ig:NumericYAxis>
    </ig:XamDataChart.Axes>
    <ig:XamDataChart.Series>
        <ig:LineSeries ValueMemberPath="ValueInMln"
                       DataContext="{Binding USA}"
                       ItemsSource="{Binding}"
                       Title="{Binding Country}"
                       XAxis="{Binding ElementName=XAxis}"
                       YAxis="{Binding ElementName=YAxis}" >
        </ig:LineSeries>
        <ig:LineSeries ValueMemberPath="ValueInMln"
                       DataContext="{Binding RUS}"
                       ItemsSource="{Binding}"
                       Title="{Binding Country}"
                       XAxis="{Binding ElementName=XAxis}"
                       YAxis="{Binding ElementName=YAxis}" >
        </ig:LineSeries>
        <!-- this single callout layer is targeting ItemsSource of multiple series: -->
        <ig:CalloutLayer x:Name="AutoCallout"
                         IsAutoCalloutBehaviorEnabled="True"
                         UseValueForAutoCalloutLabels="True"
                         AutoCalloutLabelPrecision="1"
                         XMemberPath="Index"
                         YMemberPath="ValueInMln"
                         LabelMemberPath="ChangePercentage"
                         CalloutLeaderBrush="Gray"
                         CalloutOutline="Gray"
                         CalloutBackground="DodgerBlue"
                         CalloutTextColor="White"
                         CalloutStrokeThickness="1.5">
        </ig:CalloutLayer>
    </ig:XamDataChart.Series>
</ig:XamDataChart>
C# の場合:
var callout = new CalloutLayer();
callout.IsAutoCalloutBehaviorEnabled = true;
callout.UseValueForAutoCalloutLabels = true;
callout.AutoCalloutLabelPrecision = 1;
callout.XMemberPath = "Index";
callout.YMemberPath = "ValueInMln";
callout.LabelMemberPath = "ChangePercentage";
callout.CalloutLeaderBrush = new SolidColorBrush(Colors.Gray);
callout.CalloutOutline = new SolidColorBrush(Colors.Gray);
callout.CalloutBackground = new SolidColorBrush(Colors.DodgerBlue);
callout.CalloutTextColor = new SolidColorBrush(Colors.White);
callout.CalloutStrokeThickness = 1.5;
DataChart.Series.Add(callout);