バージョン

XamShapeChart で凡例を使用

このトピックは、コード例を示して、凡例を XamShapeChart コントロールにドックする方法を説明します。

概要

XamShapeChart コントロールで凡例の表示がサポートされますが現在デフォルトではチャート コントロール シリーズの凡例を表示しません。シェープ チャートで共通の凡例を表示する場合、Legend オブジェクトをアプリケーションに追加し、それを XamShapeChart コントロールの Legend プロパティにバインドする必要があります。

Legend 要素はチャートでプロットされる SeriesTitle プロパティから項目の名前を取得します。シリーズ名は "SeriesType (XMemberPath vs YMemberPath)" の書式で表示されます。これを回避するには、XamShapeChart の SeriesAdded イベントを使用する必要があります。このイベントのイベント引数は Series プロパティを使用して追加されているシリーズを取得でき、Title プロパティの設定に使用して Legend に表示されるシリーズの表示を変更できます。

コード例

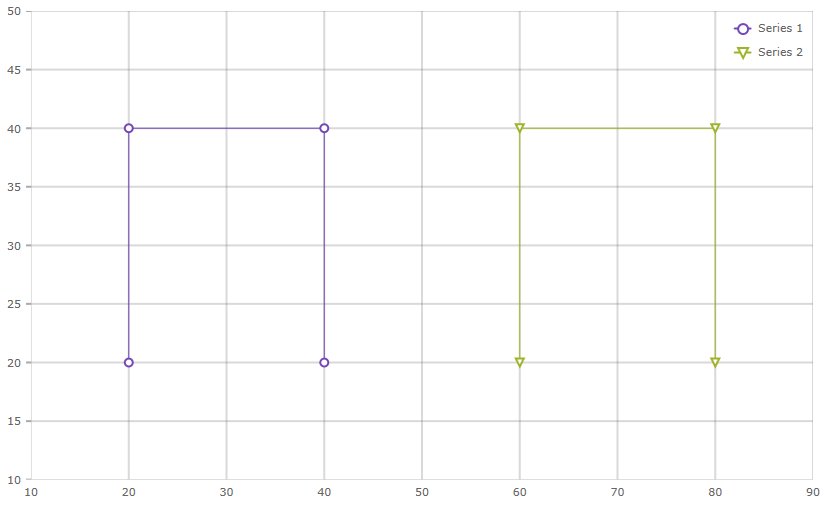
以下のコード例は、XamShapeChart コントロールにプロットした複数シリーズに共通 Legend を追加し、SeriesAdded イベントを使用してシリーズ名を書式設定する方法を示します。このコード例はシェープ チャートの以下のデータを使用します。

C# の場合:

public class ScatterData : List<List<Point>>
{
    public ScatterData()
    {
        List<Point> list1 = new List<Point>();
        List<Point> list2 = new List<Point>();

        list1.Add(CreatePoint(20, 20));
        list1.Add(CreatePoint(20, 40));
        list1.Add(CreatePoint(40, 40));
        list1.Add(CreatePoint(40, 20));

        list2.Add(CreatePoint(60, 20));
        list2.Add(CreatePoint(60, 40));
        list2.Add(CreatePoint(80, 40));
        list2.Add(CreatePoint(80, 20));

        this.Add(list1);
        this.Add(list2);
    }

    private Point CreatePoint(double x, double y)
    {
        Point point = new Point() { X = x, Y = y };
        return point;
    }
}

XAML の場合:

<Grid x:Name="layoutRoot">
    <ig:XamShapeChart x:Name="shapeChart" ItemsSource="{Binding}"
                      Legend="{Binding ElementName=legend}"
                      SeriesAdded="shapeChart_SeriesAdded"/>

    <ig:Legend x:Name="legend" />
</Grid>

C# の場合:

var shapeChart = new XamShapeChart();
var legend = new Legend();

shapeChart.ItemsSource = new ScatterData();
shapeChart.Legend = legend;
shapeChart.SeriesAdded += shapeChart_SeriesAdded;

layoutRoot.Children.Add(shapeChart);
layoutRoot.Children.Add(legend);

int count = 1;
private void shapeChart_SeriesAdded(object sender, Infragistics.Controls.Charts.ChartSeriesEventArgs args)
{
    Series series = args.Series;
    series.Title = "Series " + count.ToString();
    count++;
}

VB の場合:

Dim shapeChart = New XamShapeChart()
Dim legend = New Legend()

shapeChart.ItemsSource = New ScatterData()
shapeChart.Legend = legend
shapeChart.SeriesAdded += shapeChart_SeriesAdded

layoutRoot.Children.Add(shapeChart)
layoutRoot.Children.Add(legend)

Dim count As Integer = 1
Private Sub shapeChart_SeriesAdded(sender As Object, args As Infragistics.Controls.Charts.ChartSeriesEventArgs)
	Dim series As Series = args.Series
	series.Title = "Series " + count.ToString()
	count += 1
End Sub

上記の手順を完了すると XamShapeChart は以下のような結果になります。

shapechart_legend.png