
Ignite UI for JavaScriptチャートで大量のデータセットを高速に実行
Ignite UI for JavaScript Chartsは、数千のデータポイントを含む大規模なデータセットを非常に高速かつスムーズにレンダリングできます。
このレッスンの最後には、Angularアプリケーションで大量のデータセットを処理するように構成されたグラフを作成できるようになります。大量のデータがある場合でも、グラフはすばやくレンダリングされ、グラフのズームインとズームアウトは滑らかで応答性が高いことがわかります。
JavaScript AngularコンポーネントのIgnite UIについての詳細をご覧ください。また、Infragisticsが発行する無料の電子書籍であるAngular EssentialsでAngularについて詳しく知ることができます。
レッスンの目的
- Ignite UI for JavaScript グラフを REST API と連携するように構成します。
- 大量のデータセットを含むグラフを作成します。
このレッスンで使用するコントロールの詳細については、「Ignite UIデータ チャート」を参照してください。
プロジェクトの設定
このレッスンのスタータープロジェクトは、ここをクリックしてダウンロードできます。(こちらをクリックして最終プロジェクトをダウンロードすることもできます。
プロジェクトをダウンロードしたら、ディレクトリに移動し、次のコマンドを実行します。
- npm install
- npm start
npm install コマンドを実行してすべての依存関係をインストールし、npm start コマンドを実行してAngularアプリケーションを実行します。プロジェクトが正しく設定されている場合は、次の図に示すように、Angularアプリケーションが実行されます。アプリケーションの実行中にエラーが発生した場合は、npm start コマンドを停止して再度実行してください。
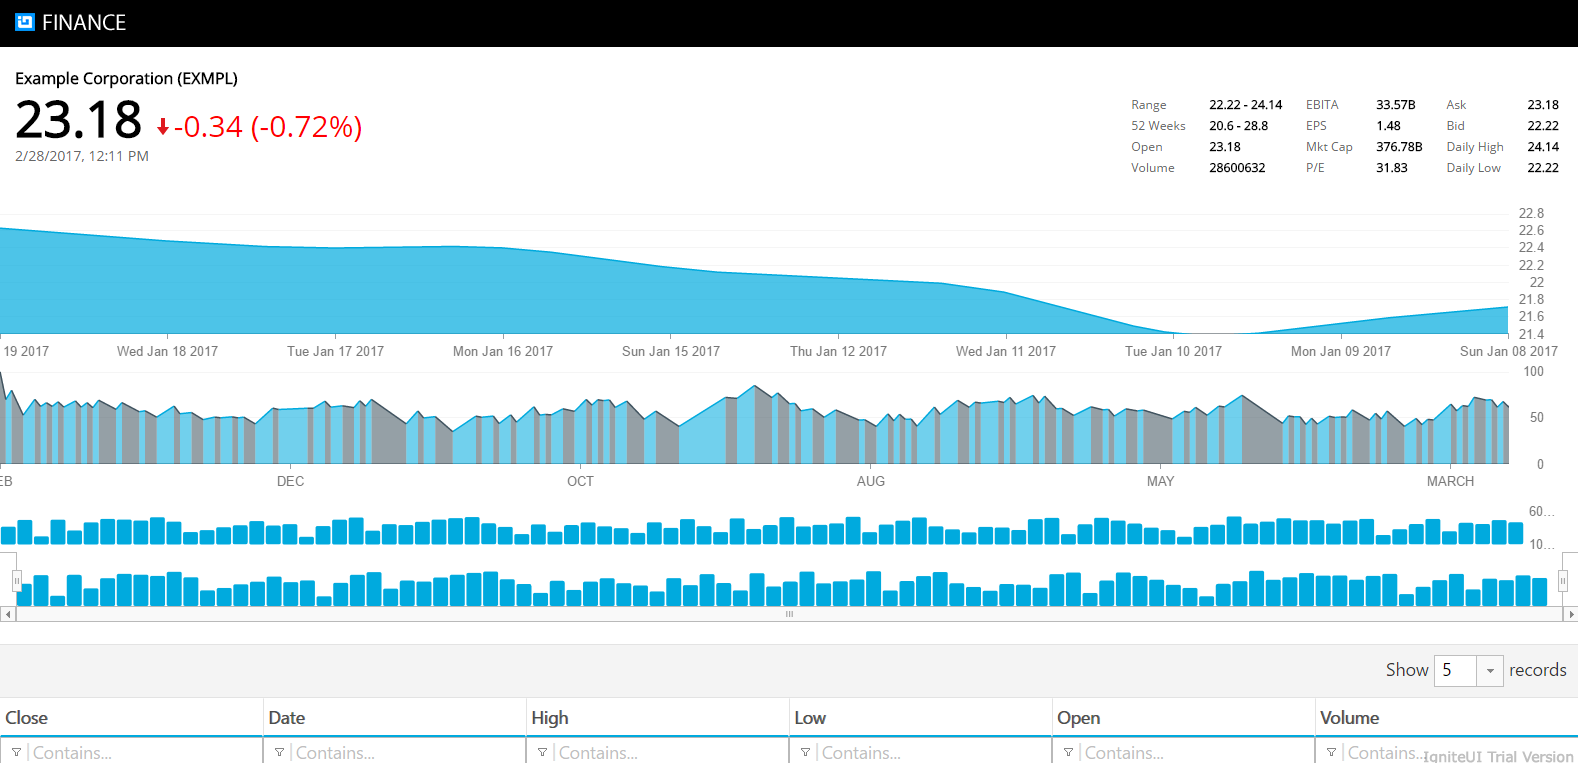
現在、アプリケーションの最初のグラフは、小さなデータ セットで動作するように構成されています。10行のデータ ソースをレンダリングし、スムーズに機能しているため、グラフをズームインおよびズームアウトできます。Ignite UI for JavaScript グラフは、大小のデータセットで動作するように作成されます。10個のデータポイントをレンディングする場合でも、1000個のデータポイントをレンディングする場合でも、Ignite UI for JavaScriptチャートは同じようにスムーズでシームレスな方法で動作し、アプリケーションをより高速に実行するのに役立ちます。
実際の動作を確認するには、REST API から返される大きなデータ セットを操作するようにグラフを変更します。
ステップ 1コンポーネント内のデータの取得
現在、チャートの小さなデータセットは、ngOnInit()関数のコードの最初の行で構成されています。PriceChartComponent で大きなデータ セットを取得するには、コンポーネントで AppService を使用する必要があります。これを行うには、appフォルダでpricechart.component.tsファイルを開き、ngOnInit()関数に移動し、(関数内で)コードの最初の行を削除して、appService getStcoks()メソッドを呼び出します。以下に示すように、コードの最初の行のみを置き換え、 ngOnInit() 他のコードはそのまま機能させます。
ngOnInit() {
  this._appService.getStocks()
  .subscribe(
    stocks => this.stocks = stocks,
    error => this.errorMessage = error);
  this.desiredHeight = 0.22 * (window.screen.height) + "px";
  this.chartOptions = this.getPriceChartOptions();
}
現在、PriceChartComponent で AppService からデータをフェッチしています。AppService の getStocks() メソッドは、200 を超えるデータ ポイントを持つ REST API からデータをフェッチしています。基本的には、大規模なデータセットを処理するようにグラフを再構成しました。
Step 2 Run the Application
アプリケーションに移動すると、Ignite UI for JavaScriptチャートが200を超えるデータポイントの大規模なセットを非常に迅速かつスムーズにレンダリングしていることがわかります。
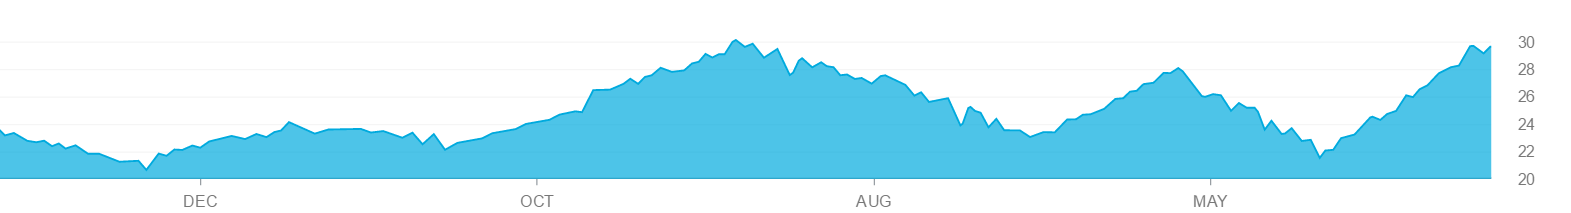
特定のデータ ポイントにズームアウトすると、Ignite UI for JavaScript グラフも同じようにレンダリングされ、アプリケーションの実行速度が向上します。

結論
Ignite UI for JavaScriptは、より高速なWebアプリケーションを作成するのに非常に役立ちます。Angularに加えて、React、AngularJS、jQuery、およびASP.NET MVCの JavaScript Ignite UIを使用できます。Ignite UI for JavaScript チャートのさまざまな機能 (ズームインやズームアウトなど) は、小さなデータセットと大きなデータセットの両方でシームレスに動作します。