
このトピックでは、ScaleLegend コントロールの構成に関する情報、また XamDataChart™ コントロールで チャート シリーズを使用する方法についても説明します。
トピックは以下のとおりです。
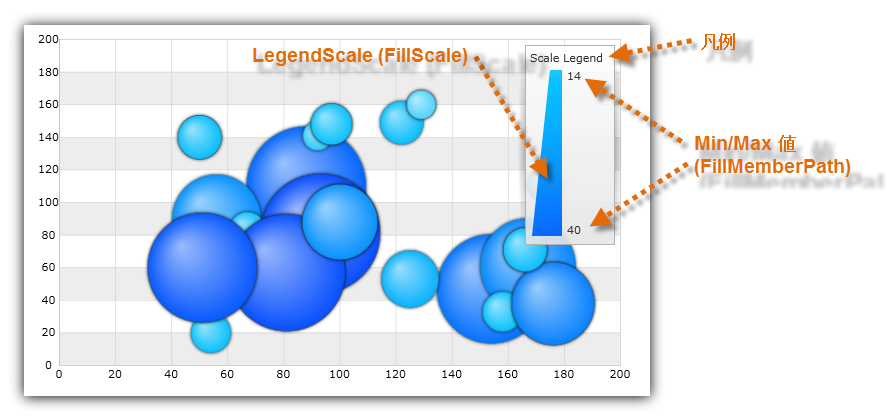
スケール凡例は特殊なタイプの凡例で、 ValueBrushScale または CustomPaletteBrushScale の Brushes コレクションで、 BubbleSeries のバブルに色を割り振る方法を示します。BubbleSeries の FillMemberPath プロパティにマップされるデータ列からの最小値と最大値も表示します。ブラシ スケールの使用方法の詳細は、 散布バブル シリーズトピックを参照してください。
項目凡例コントロールは、他のチャート凡例タイプのある共通プロパティを共有します。これらの共通プロパティの一覧は、 チャート凡例 トピックを参照してください。
スケール凡例は、シリーズが以下の表のバインド要件を満たしている場合のみ BubbleSeries で使用できます。
コード スニペットは、バブルの塗りつぶしスケールとして ValueBrushScale を使用して Scale Legend を BubbleSeries にバインドする方法を示します。
図 2: バブルの塗りつぶしスケールとして ValueBrushScale を使用して BubbleSeries にバインドされた ScaleLegend
XAML の場合:
xmlns:ig="clr-namespace:Infragistics.XamarinForms.Controls.Charts;assembly=Infragistics.XF.Charts"
xmlns:dv="clr-namespace:Infragistics.XamarinForms;assembly=Infragistics.XF.DataVisualization"
...
<ig:XamDataChart >
    ...
    <ig:XamDataChart.Series>
        <ig:BubbleSeries FillMemberPath="Radius"
                         Legend="{x:Reference ScaleLegend}" >
            <ig:BubbleSeries.FillScale>
                <ig:ValueBrushScale MaximumValue="50" MinimumValue="5">
                    <ig:ValueBrushScale.Brushes>
                        <dv:BrushCollection>
                            <dv:SolidColorBrush Color="#FFC6EEFB" />
                            <dv:SolidColorBrush Color="#FF08C3FE" />
                            <dv:SolidColorBrush Color="#FF08A5FE" />
                            <dv:SolidColorBrush Color="#FF086AFE" />
                            <dv:SolidColorBrush Color="#FF084CFE" />
                        </dv:BrushCollection>
                    </ig:ValueBrushScale.Brushes>
                </ig:ValueBrushScale>
            </ig:BubbleSeries.FillScale>
        </ig:BubbleSeries>
    </ig:XamDataChart.Series>
</ig:XamDataChart>
<ig:ScaleLegend x:Name="ScaleLegend"
                HorizontalOptions="EndAndExpand"
                VerticalOptions="StartAndExpand">
</ig:ScaleLegend >
C# の場合:
using Infragistics.XamarinForms.Controls.Charts;
using Infragistics.XamarinForms;
...
var scaleLegend = new ScaleLegend
{
    Margin = new Thickness(20),
    VerticalOptions = LayoutOptions.StartAndExpand,
    HorizontalOptions = LayoutOptions.EndAndExpand
};
var brushCollection = new BrushCollection();
brushCollection.Add(new SolidColorBrush(Color.FromHex("#FFC6EEFB")));
brushCollection.Add(new SolidColorBrush(Color.FromHex("#FF08C3FE")));
brushCollection.Add(new SolidColorBrush(Color.FromHex("#FF08A5FE")));
brushCollection.Add(new SolidColorBrush(Color.FromHex("#FF08A5FE")));
brushCollection.Add(new SolidColorBrush(Color.FromHex("#FF084CFE")));
var brushScale = new ValueBrushScale();
brushScale.Brushes = brushCollection;
brushScale.MinimumValue = 5;
brushScale.MaximumValue = 200;
var series = new BubbleSeries();
series.FillScale = brushScale;
series.FillMemberPath = "Radius";
series.Legend = scaleLegend;
...
var DataChart = new XamDataChart();
dataChart.Series.Add(series);