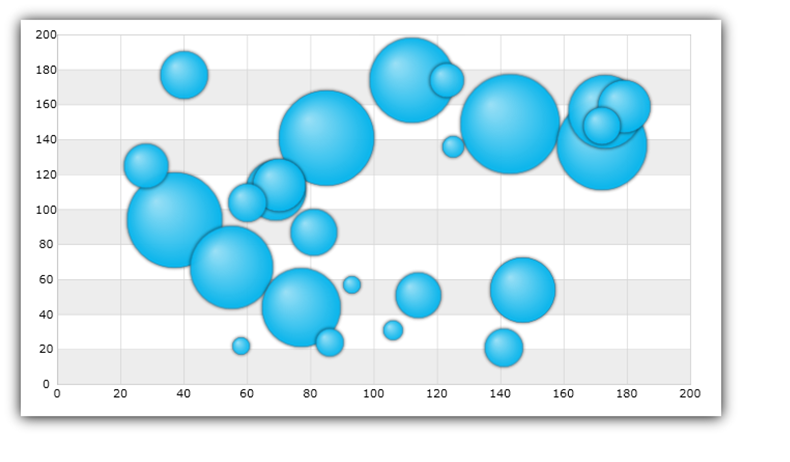
このトピックは、コード例を示して、 BubbleSeries を XamDataChart コントロールで使用する方法を説明します。いくつかの重要な概念的情報も提供します。
BubbleSeries は、データをプロットにデカルト座標 (x, y) システムを使用する散布シリーズのファミリに属します。このシリーズは、スケールしたバブルのコレクションとしてデータを表示します。各シリーズはデカルト座標システムの位置を決定する 1 組の数値 X/Y 値とサイズを決定する 3 つ目の値を持ちます。
散布シリーズでは、データの不均等な散らばりやデータの塊に注意が向けられます。予測結果の収集データの標準偏差を強調表示し、科学データや統計データをプロットするためによく使用されます。散布シリーズの特性に加えて、BubbleSeries マーカー (バブル) のサイズはデータ駆動型です。以下のセクションは、BubbleSeries とその機能を使用する方法で重要なコンセプトやタスクベースの情報を示します。

図 1: BubbleSeries 実装例
BubbleSeries は ItemsSource プロパティを使用し、IEnumerable インターフェイス (List、Collection、Queue、Stack など) を実装するデータ オブジェクトへバインドします。ただし、このオブジェクトの各データ項目には、2 つの数値データ列 (デカルト座標系でバブルを配置する X および Y 値用) に加えて、1 つの数値データ列 (バブルのサイズ用) がなければなりません。データ列は RadiusMemberPath、 XMemberPath、および YMemberPath プロパティを使用してマップされます。
上記の基準を満たすオブジェクトに BubbleDataSource があり、ダウンロードしてプロジェクトで使用できます。
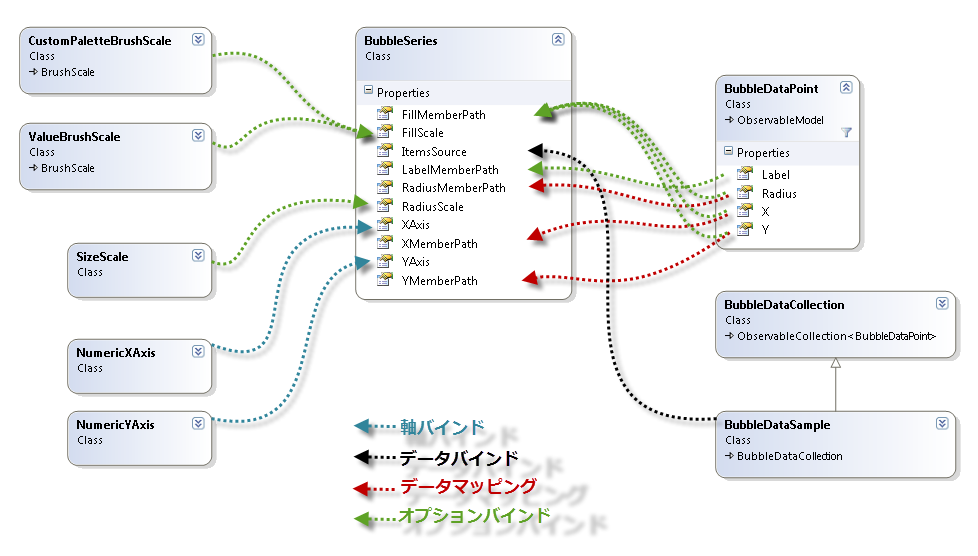
図 2: XamDataChart コントロールでデータを BubbleSeries にバインドする概略図
このコード スニペットは、サンプル バブル データを BubbleSeries にバインドする方法を説明します。
XAML の場合:
xmlns:local="clr-namespace:Infragistics.Models;assembly=YourAppName"
...
<ig:XamDataChart >
    <ig:XamDataChart.Resources>
        <local:BubbleDataSource x:Key="data"/>
    </ig:XamDataChart.Resources>
    <ig:XamDataChart.Axes>
        <ig:NumericXAxis x:Name="XAxis" />
        <ig:NumericYAxis x:Name="YAxis" />
    </ig:XamDataChart.Axes>
    <ig:XamDataChart.Series>
		<ig:BubbleSeries ItemsSource="{StaticResource data}"
                         XAxis="{Binding ElementName=XAxis}"
                         YAxis="{Binding ElementName=YAxis}"
                         XMemberPath="X"
                         YMemberPath="Y"
                         RadiusMemberPath="Radius">
        </ig:BubbleSeries>
    </ig:XamDataChart.Series>
</ig:XamDataChart>
C# の場合:
var data = new BubbleDataSource();
var xAxis = new NumericXAxis();
var yAxis = new NumericYAxis();

var series = new BubbleSeries();
series.XAxis = xAxis;
series.YAxis = yAxis;
series.XMemberPath = "X";
series.YMemberPath = "Y";
series.RadiusMemberPath = "Radius";
series.ItemsSource = data;
DataChart.Axes.Add(xAxis);
DataChart.Axes.Add(yAxis);
DataChart.Series.Add(series);
Visual Basic の場合:
Dim data As New BubbleDataSource()
Dim xAxis As New NumericXAxis()
Dim yAxis As New NumericYAxis()

Dim series As New BubbleSeries()
series.ItemsSource = data
series.XMemberPath = "X"
series.YMemberPath = "Y"
series.RadiusMemberPath = "Radius"
series.XAxis = xAxis
series.YAxis = yAxis
Dim chart As New XamDataChart()
chart.Axes.Add(xAxis)
chart.Axes.Add(yAxis)
chart.Series.Add(series)
バブル サイズ スケールは、シリーズの RadiusScale プロパティでバブルのサイズを決定する BubbleSeries のオプション機能です。この機能は SizeScale オブジェクトを介して実装されます。半径スケールが設定されると、最小のバブルは MinimumValue と等しくなり、最大のバブルは MaximumValue と等しくなり、すべての残りのバブルはそれに応じて拡大/縮小されます。サイズ スケールはリニアと対数のいずれかにすることができます。半径スケールが設定されていない場合には、各バブルのサイズは RadiusMemberPath プロパティにマップされたデータ列の値に等しくなります。
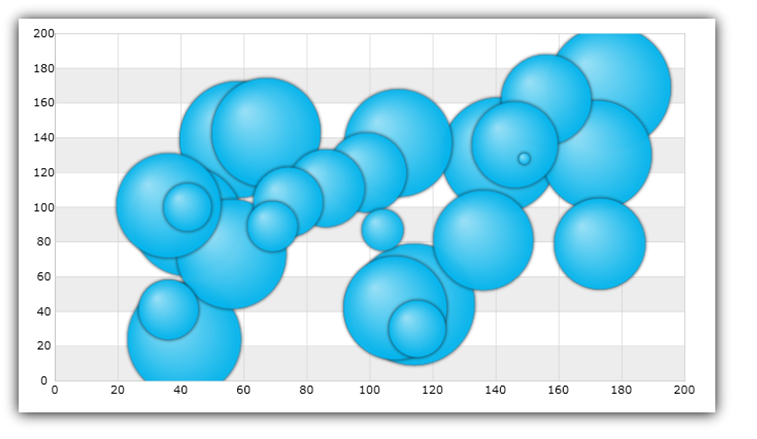
図 3: バブル サイズ スケールの実装例
このコードは、SizeScale オブジェクトを使用して、BubbleSeries でバブルのサイズを拡大/縮小する方法を示します。
XAML の場合:
<ig:BubbleSeries.RadiusScale>
    <ig:SizeScale IsLogarithmic="False" MaximumValue="120" MinimumValue="20"/>
</ig:BubbleSeries.RadiusScale>
Visual Basic の場合:
Dim sizeScale As New SizeScale()
sizeScale.IsLogarithmic = False
sizeScale.MinimumValue = 20
sizeScale.MaximumValue = 120
Dim series As New BubbleSeries()
series.RadiusScale = sizeScale
C# の場合:
SizeScale sizeScale = new SizeScale();
sizeScale.IsLogarithmic = false;
sizeScale.MinimumValue = 20;
sizeScale.MaximumValue = 120;
BubbleSeries series = new BubbleSeries();
series.RadiusScale = sizeScale;
バブル ブラシ スケールは、シリーズ オブジェクトの FillScale プロパティを介して 1 つの BubbleSeries 内の色パターンを決定するオプション機能です。BubbleSeries サポートは以下のブラシ スケールをサポートします。
カスタム ブラシ スケール
値ブラシ スケール
各スケールには、色パターンを定義するブラシのコレクションを持ちます。スケールについてはサブセクションで説明します。
CustomPaletteBrushScale は、 Brushes コレクションからブラシを選択するバブル マーカーのインデックスを使用します。BrushSelectionMode プロパティを Select 列挙値に設定した場合、バブルが連続して色付けされます。BrushSelectionMode が Interpolate に設定されると、ブラシがコレクションのバブルのインデックスとブラシの数に基づいて補間されます。
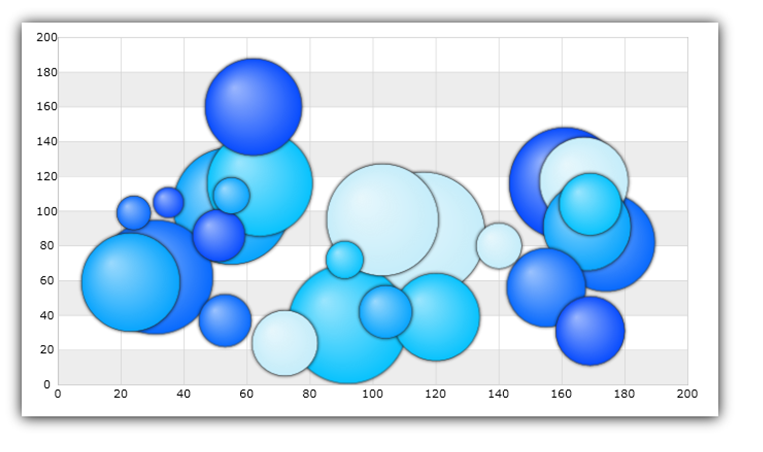
図 4: カスタム ブラシ スケールの実装例
このコード スニペットは、CustomPaletteBrushScale オブジェクトを使用して、BubbleSeries でバブルの色を塗りつぶす方法を示します。
XAML の場合:
xmlns:ig="http://schemas.infragistics.com/xaml"
...
<ig:BubbleSeries XMemberPath="X"
                 YMemberPath="Y"
                 FillMemberPath="Radius"
                 RadiusMemberPath="Radius">
    <ig:BubbleSeries.FillScale>
        <ig:CustomPaletteBrushScale BrushSelectionMode="Interpolate">
            <ig:CustomPaletteBrushScale.Brushes>
                <ig:BrushCollection>
                    <SolidColorBrush Color="#FFC6EEFB" />
                    <SolidColorBrush Color="#FF08C3FE" />
                    <SolidColorBrush Color="#FF08A5FE" />
                    <SolidColorBrush Color="#FF086AFE" />
                    <SolidColorBrush Color="#FF084CFE" />
                </ig:BrushCollection>
            </ig:CustomPaletteBrushScale.Brushes>
        </ig:CustomPaletteBrushScale>
    </ig:BubbleSeries.FillScale>
</ig:BubbleSeries>
C# の場合:
var brushCollection = new BrushCollection();
brushCollection.Add(new SolidColorBrush(Color.FromArgb(0xFF, 0xC6, 0xEE, 0xFB)));
brushCollection.Add(new SolidColorBrush(Color.FromArgb(0xFF, 0x08, 0xC3, 0xFE)));
brushCollection.Add(new SolidColorBrush(Color.FromArgb(0xFF, 0x08, 0xA5, 0xFE)));
brushCollection.Add(new SolidColorBrush(Color.FromArgb(0xFF, 0x08, 0x6A, 0xFE)));
brushCollection.Add(new SolidColorBrush(Color.FromArgb(0xFF, 0x08, 0x4C, 0xFE)));
var brushScale = new CustomPaletteBrushScale();
brushScale.BrushSelectionMode = BrushSelectionMode.Interpolate;
brushScale.Brushes = brushCollection;
var series = new BubbleSeries();
series.FillScale = brushScale;
series.FillMemberPath = "Radius";
Visual Basic の場合:
Dim brushCollection As New BrushCollection()
brushCollection.Add(New SolidColorBrush(Color.FromArgb(&HFF, &HC6, &HEE, &HFB)))
brushCollection.Add(New SolidColorBrush(Color.FromArgb(&HFF, &H08, &HC3, &HFE)))
brushCollection.Add(New SolidColorBrush(Color.FromArgb(&HFF, &H08, &HA5, &HFE)))
brushCollection.Add(New SolidColorBrush(Color.FromArgb(&HFF, &H08, &H6A, &HFE)))
brushCollection.Add(New SolidColorBrush(Color.FromArgb(&HFF, &H08, &H4C, &HFE)))
Dim brushScale As New CustomPaletteBrushScale()
brushScale.BrushSelectionMode = BrushSelectionMode.Interpolate
brushScale.Brushes = brushCollection
Dim series As New BubbleSeries()
series.FillScale = brushScale
series.FillMemberPath = "Radius"ValueBrushScale – バブルの補間ブラシを決定するために ItemsSource の数値列の 1 つからの値セットを使用してブラシを補間します。列は FillMemberPath プロパティで指定されます。この軸スケールはリニアと対数のいずれかにすることができます。またユーザー指定の MinimumValue や MaximumValue を持つこともできます。このスケールで範囲が設定されると、範囲外になる値を持つバブルが Brushes コレクションからブラシを取得せずに、色も付けられません。
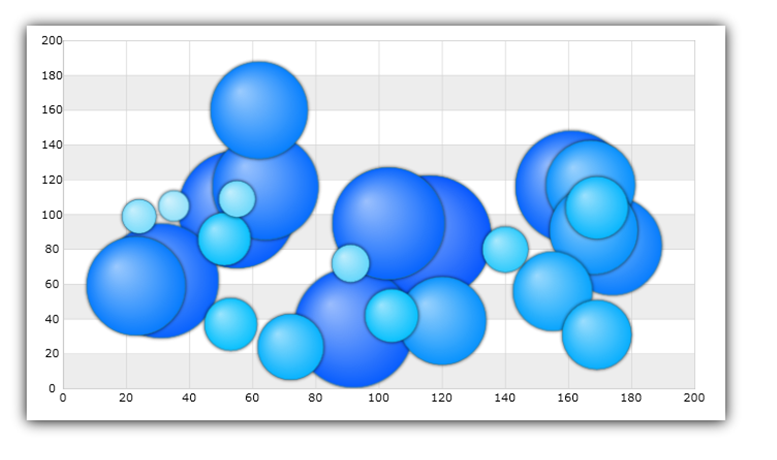
図 5: 値ブラシ スケールの実装例
このコード スニペットは、ValueBrushScale オブジェクトを使用して、BubbleSeries でバブルの色を塗りつぶす方法を示します。
XAML の場合:
xmlns:ig="http://schemas.infragistics.com/xaml"
...
<ig:BubbleSeries XMemberPath="X"
                 YMemberPath="Y"
                 FillMemberPath="Radius"
                 RadiusMemberPath="Radius">
    <ig:BubbleSeries.FillScale>
        <ig:ValueBrushScale IsLogarithmic=" MaximumValue="200" MinimumValue="5">
            <ig:ValueBrushScale.Brushes>
                <ig:BrushCollection>
                    <SolidColorBrush Color="#FFC6EEFB" />
                    <SolidColorBrush Color="#FF08C3FE" />
                    <SolidColorBrush Color="#FF08A5FE" />
                    <SolidColorBrush Color="#FF086AFE" />
                    <SolidColorBrush Color="#FF084CFE" />
                </igCommon:BrushCollection>
            </ig:ValueBrushScale.Brushes>
        </ig:ValueBrushScale>
    </ig:BubbleSeries.FillScale>
</ig:BubbleSeries>
C# の場合:
var brushCollection = new BrushCollection();
brushCollection.Add(new SolidColorBrush(Color.FromArgb(0xFF, 0xC6, 0xEE, 0xFB)));
brushCollection.Add(new SolidColorBrush(Color.FromArgb(0xFF, 0x08, 0xC3, 0xFE)));
brushCollection.Add(new SolidColorBrush(Color.FromArgb(0xFF, 0x08, 0xA5, 0xFE)));
brushCollection.Add(new SolidColorBrush(Color.FromArgb(0xFF, 0x08, 0x6A, 0xFE)));
brushCollection.Add(new SolidColorBrush(Color.FromArgb(0xFF, 0x08, 0x4C, 0xFE)));
var brushScale = new ValueBrushScale();
brushScale.IsLogarithmic = false;
brushScale.MinimumValue = 5;
brushScale.MaximumValue = 200;
brushScale.Brushes = brushCollection;
var series = new BubbleSeries();
series.FillScale = brushScale;
series.FillMemberPath = "Radius";
Visual Basic の場合:
Dim brushCollection As New BrushCollection()
brushCollection.Add(New SolidColorBrush(Color.FromArgb(&HFF, &HC6, &HEE, &HFB)))
brushCollection.Add(New SolidColorBrush(Color.FromArgb(&HFF, &H08, &HC3, &HFE)))
brushCollection.Add(New SolidColorBrush(Color.FromArgb(&HFF, &H08, &HA5, &HFE)))
brushCollection.Add(New SolidColorBrush(Color.FromArgb(&HFF, &H08, &H6A, &HFE)))
brushCollection.Add(New SolidColorBrush(Color.FromArgb(&HFF, &H08, &H4C, &HFE)))
Dim brushScale As New ValueBrushScale()
brushScale.Brushes = brushCollection
brushScale.IsLogarithmic = False
brushScale.MinimumValue = 5
brushScale.MaximumValue = 200
Dim series As New BubbleSeries()
series.FillScale = brushScale
series.FillMemberPath = "Radius"