
Ignite UI for JavaScriptデータチャートを使用してアプリケーションを迅速に作成
紹介
Ignite UI for JavaScript を使用して、Web アプリケーションを作成し、複雑な LOB 要件をより迅速に解決します。JavaScript のIgnite UIライブラリは、数行のコードで複雑で動的なグラフを Web アプリケーションにすばやく追加できます。
Ignite UI for JavaScript では、さまざまな種類のグラフを使用できます。
- データ チャート:x軸とy軸にデータを棒、線、面などとして表示します。
- 円チャート: データを円で囲み、それぞれがデータ全体の割合を表すセクターに分割して表示します。
- ドーナツ チャート: データを円で囲み、複数のデータ系列を表示します。
Ignite UI for JavaScriptには、約50種類のデータチャートが含まれています。詳細については、「JavaScriptデータ チャートのIgnite UIを参照してください。また、Infragisticsが発行する無料の電子書籍「Angular Essentials」でも、Angularについて詳しく知ることができます。
レッスンの目的
- JavaScript DataChart AngularコンポーネントのIgnite UIを追加します。
- 軸、データソース、およびシリーズのデータグラフを設定します。
- さまざまな系列タイプのデータグラフを設定します。
レッスンの最後には、Angularアプリケーションのさまざまなタイプのシリーズに対して構成された作業データ チャートが作成されます。
詳しくは、JavaScript のIgnite UI Angularコンポーネントをご覧ください。
プロジェクトの設定
このレッスンのスターター プロジェクトをダウンロードするには、ここをクリックしてください。(こちらをクリックして最終プロジェクトをダウンロードすることもできます。
プロジェクトをダウンロードしたら、ディレクトリに移動し、次のコマンドを実行します。
- npm install
- npm start
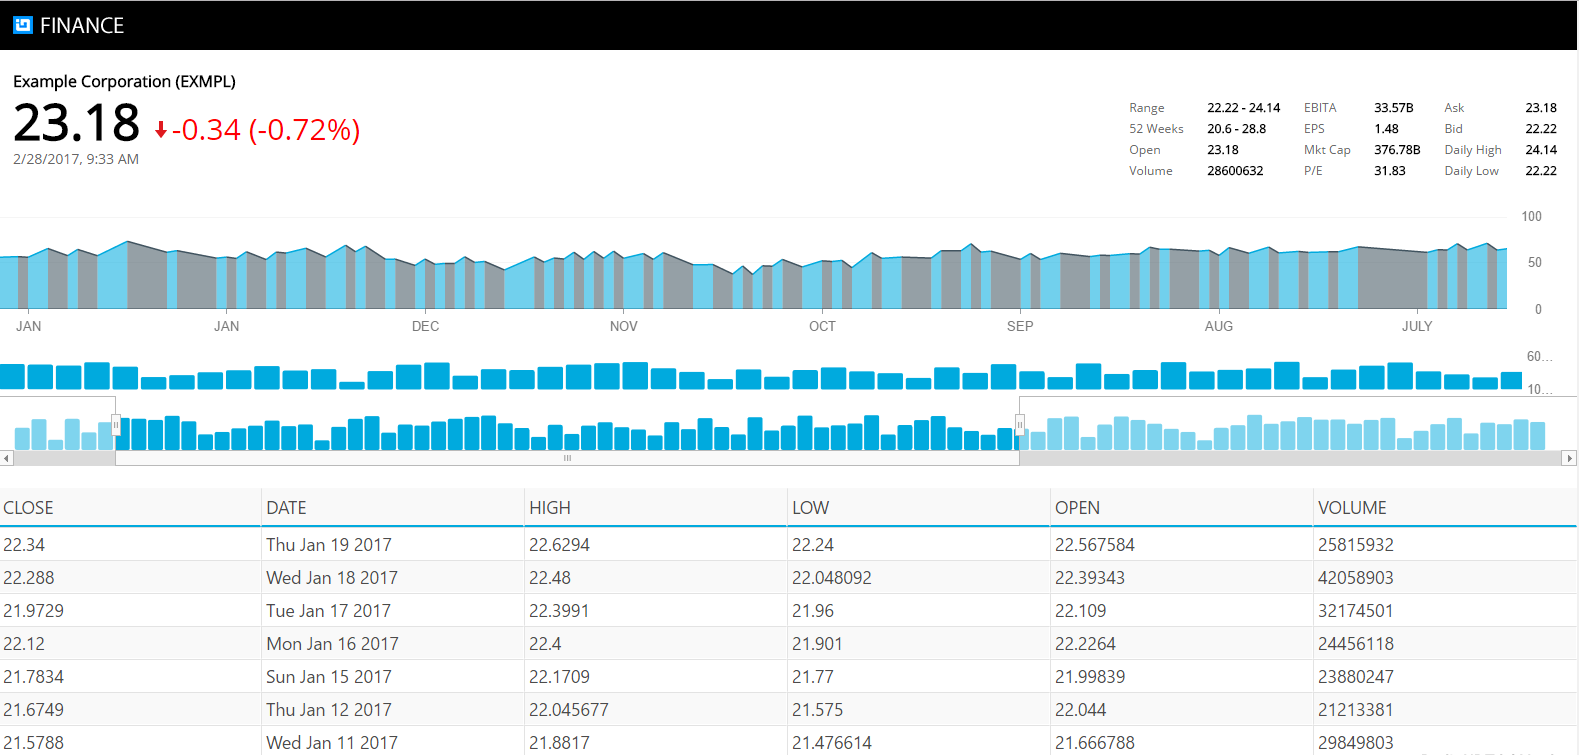
npm install コマンドを実行すると、すべての依存関係がインストールされます。npm start コマンドを実行すると、Angularアプリケーションが実行されます。プロジェクトの設定が正しい場合は、次に示すようにAngularアプリケーションが実行されます。アプリケーションの実行中にエラーが発生した場合は、npm start コマンドを停止して再度実行してください。
ステップ 1コンポーネントのインポートと宣言
Ignite UI for JavaScript Angularコンポーネントを使用するには、モジュールでコンポーネントをインポートして宣言する必要があります。たとえば、Angularアプリケーションで igDataChart コンポーネントを使用するには、アプリケーション モジュールで IgDataChartComponent をインポートして宣言します。
プロジェクトで、Finance App フォルダーに移動し、次に app フォルダーに移動します。app.module.tsファイルを開くと、igDataChartComponent が追加されていることがわかります。既存の import ステートメントの後に、以下の import ステートメントを追加します。
import{PriceChartComponent} from './charts/pricechart.component';必要なコンポーネントをインポートしたら、アプリケーションモジュールで宣言する必要があります。AppModule の宣言配列に PriceChartComponent を追加します。app.module.ts でデコレータ@NgModule次のように変更します。
@NgModule({
imports: [BrowserModule, HttpModule],
declarations: [AppComponent,
         IgZoombarComponent,
         IgDataChartComponent,
         InfoComponent,
         IndicatorChartComponent,
         VolumeChartComponent,
         IgGridComponent,
         GridComponent,
         PriceChartComponent],
         providers: [AppService],
         bootstrap: [AppComponent]
})
これで、AppModuleモジュールの宣言配列にPriceChartComponentが追加されました。その他の追加コンポーネントやプロバイダーなどの他のプロパティについては、以降のレッスンで説明します。
Step 2 Create a Data Source
データ グラフのバインドに必要なデータは、JavaScript 配列または JSON オブジェクト配列にすることができ、ローカルにすることも、REST サービスによって提供されることもできます。
理想的には、Angularサービスでデータを返す関数を作成して、データが複数のコンポーネントで機能するようにする必要があります。このレッスンでは、PriceChartComponentクラスにすでにgetDataという関数があり、JSONオブジェクト配列を返します。app\charts フォルダで、ファイル pricechart.component.ts を開き、getData() 関数を見つけます。今後のレッスンでは、REST サービスからのデータを使用するグリッドの作成方法を学習します。
Step 3 Get Data
getData() 関数から返されたデータを使用するには、Angular ngOnInit() ライフ サイクル フック内で関数を呼び出し、戻り値を PriceChartComponent プロパティに割り当てます。
Angular Life Cycle フックの詳細をご覧ください。
app\chartsフォルダで、ファイルpricechart.component.tsを開き、次に示すようにngOnInit()関数を変更します。
ngOnInit() {
  this.stocks = this.getData();
}
Step 4 Configure Axes
データ グラフを作成するには、グラフ オプションを構成する必要があります。チャートオプションは、次の3つの主要なプロパティで構成されています。
- X 軸と Y 軸
- Data source
- 級数
その他の重要なプロパティには、高さ、幅、タイトルなどがあります。
軸を設定するには、pricechart.component.ts ファイルを開きます。ngOnInit()関数の直後に、以下に示すようにgetPriceChartAxes()関数を追加します。
getPriceChartAxes() {
  return [
  {
    name: "xAxis",
    type: "categoryX",
    label: "Date"
  },
  {
    name: "yAxis",
    type: "numericY",
    labelLocation: "outsideRight",
    labelExtent: 40
  }
  ];
}
上記のリストでは、次のようになります。
- X 軸タイプと Y 軸タイプを使用して、財務、散布図、またはカテゴリの価格シリーズを表示できます。その他の可能な値には、category、numericAngle、categoryDateTimeX、categoryAngle などがあります。
- Y 軸の labelExtent 値は 40 に設定され、ラベル専用の領域のサイズ、またはラベルが軸からどれだけ離れるかを指定します。
これらの値とグラフの種類については、シリーズ タイプデータ チャートをご覧ください。
ステップ 5シリーズの構成
Ignite UI for JavaScript のデータ グラフには、任意の数の系列を含めることができますが、少なくとも 1 つは必要です。app\charts フォルダーのデータ グラフに系列を追加するには、pricechart.component.ts ファイルを開きます。getPriceChartAxes() 関数の直後に、次に示すように getPriceChartSeries() 関数を追加します。
getPriceChartSeries() {
  return [
  {
    name: "stockSeries",
    type: "splineArea",
    title: "Price Data",
    isHighlightingEnabled: true,
    isTransitionInEnabled: true,
    xAxis: "xAxis",
    yAxis: "yAxis",
    valueMemberPath: "High",
    showTooltip: true,
    Outline: "#00AADE"
  }
  ];
}
上記のリストでは、次のようになります。
- Series type の値を splineArea に設定すると、Spline Area シリーズが作成されます。Line シリーズを作成する場合は、type の値を "line" に設定します。IgniteUI は、面グラフ、棒グラフ、縦棒グラフなど、25 種類以上の可能なシリーズ タイプを提供します。
- 系列の valueMemberPath の場合、グラフに表示するデータ配列からプロパティを設定する必要があります。ここでは、データ チャート系列でレンダリングされるデータ ソースの "Height" プロパティを設定しています。
- 系列の isTransitionInEnabled 値は true に設定され、データ ソースが割り当てられたときにアニメーションが有効になります。
Step 6 Configure Chart Option
軸とシリーズを設定しました。次に、データ グラフの他のすべての重要なプロパティを設定するグラフ オプションを構成します。
グラフのプロパティの詳細については、「JavaScriptデータ チャートのIgnite UI」を参照してください。
データ グラフを構成するには、app\charts フォルダーで pricechart.component.ts ファイルを開きます。getPriceChartSeries()関数の直後に、以下に示すようにgetPriceChartOption()関数を追加します。
getPriceChartOptions() {
  return {
    axes: this.getPriceChartAxes(),
    series: this.getPriceChartSeries(),
    windowResponse: "deferred",
    horizontalZoomable: true,
    width: "100%",
    height: this.desiredHeight,
    leftMargin: 0,
    rightMargin: 30,
    windowRectMinWidth: 0.05,
    syncChannel: "channel1",
    synchronizeVertically: false,
    synchronizeHorizontally: false
  };
}
上記のリストでは、次のようになります。
- グラフの syncChannel プロパティは、グラフをアプリケーションの他のグラフと同期して、ZoomBar などの他のコントロールの機能と対話できるように設定されます。同じチャネルで同期されたグラフは、1 つのズームバーを使用してズームインおよびズームアウトできます。
- グラフの windowResponse プロパティが "deferred" に設定されているため、グラフ ビューの更新はユーザーの操作が完了するまで延期されます。値を "immediate" に設定することもできます。
ステップ 7チャート オプションとデータ ソースの初期化
チャートオプションとデータソースを初期化するには、pricechart.component.tsファイルで、以下に示すようにngOnInit()関数を変更します。
ngOnInit() {
  this.stocks = this.getData();
  this.desiredHeight = 0.22 * (window.screen.height) + "px";
  this.chartOptions = this.getPriceChartOptions();
}
Step 8 Create Chart
グラフを作成するには、pricechart.component.htmlファイルを開き、以下のマークアップを追加します。
<ig-data-chart [(options)]="chartOptions" [(dataSource)]="stocks" widgetId="pricechart"></ig-data-chart>ステップ 9アプリケーションでの使用
アプリケーションで PriceChartComponent を使用するには、app フォルダーで app.component.html ファイルを開きます。<info-screen>要素の直後、<indicatorchart>要素の前に、以下に示すコードを追加します。
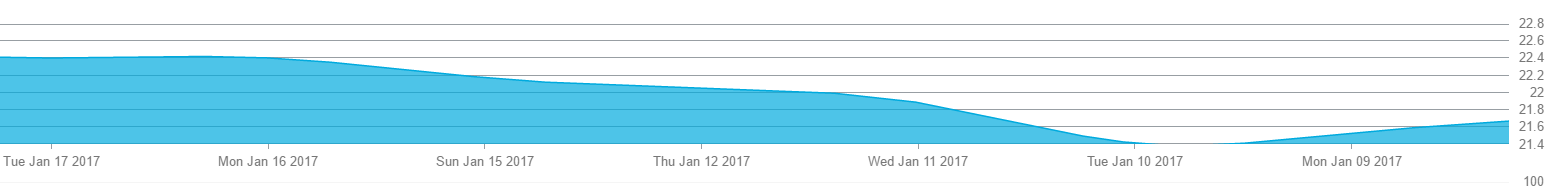
<pricechart></pricechart>アプリケーションに移動して下にスクロールすると、ページの下部に、次に示すように追加されたグラフが表示されます。
結論
Ignite UI for JavaScriptは、Webアプリケーションをすばやく作成するのに役立ちます。Angularに加えて、React、AngularJS、jQuery、およびASP.NET MVCの JavaScript Ignite UIを使用できます。