
Ultimate UI for WPF では、DataAnnotationStripLayer は、XamDataChart コンポーネントの軸上の 2 つの値の間に複数の垂直または水平のストリップを描画します。このデータ注釈レイヤーを使用して、X 軸にイベントの期間 (株式市場の暴落など) または Y 軸に重要な範囲の値に注釈を付けることができます。TargetAxis プロパティを y 軸に設定すると、データ注釈レイヤーは水平ストリップとして描画され、TargetAxis プロパティを x 軸に設定すると、データ注釈レイヤーは垂直ストリップとして描画されます。すべてのシリーズと同様に、DataAnnotationStripLayer も ItemsSource プロパティを介したデータ バインディングをサポートします。このプロパティは、AnnotationValueMemberPath プロパティにマッピングされた少なくとも 1 つの数値データ列を持つデータ項目のコレクションに設定できます。
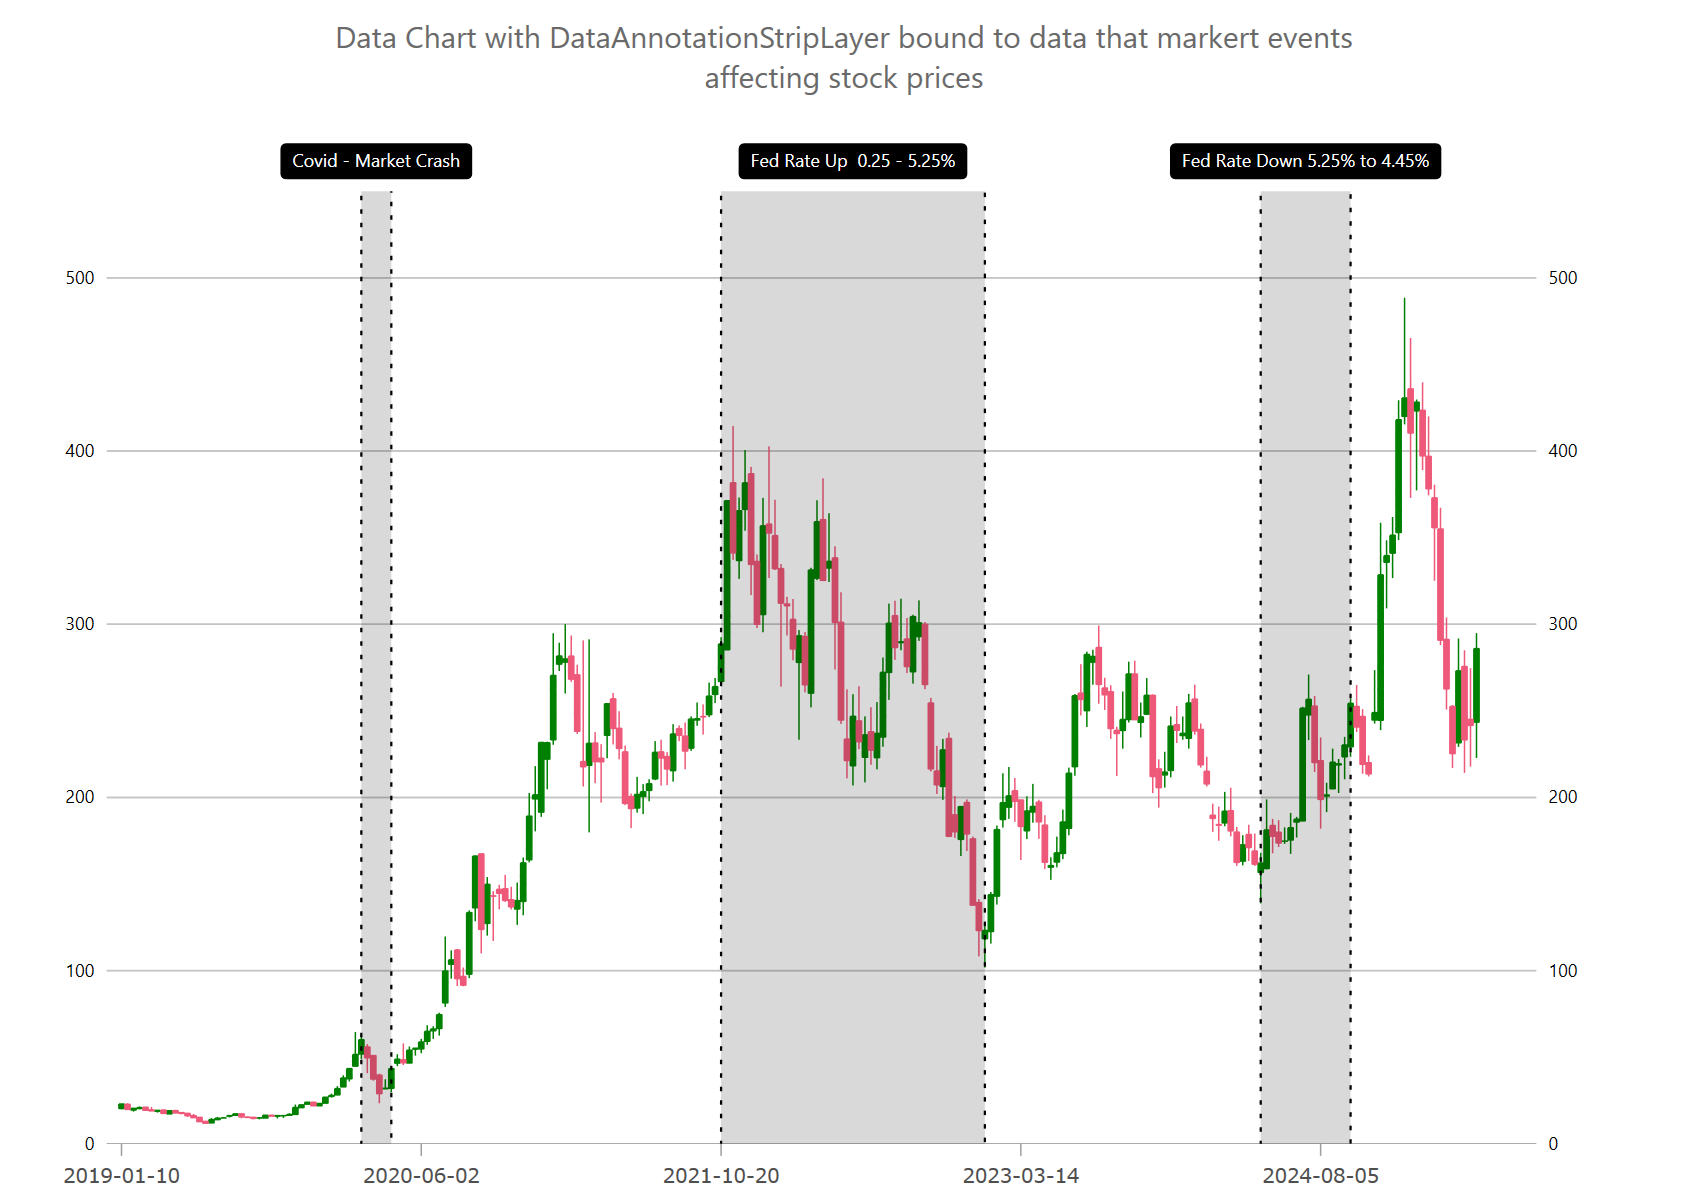
たとえば、DataAnnotationStripLayer を使用して、株式市場の暴落や連邦金利の変更をチャートに注釈として付けることができます。
次のコード スニペットは、上の図に示すように、DataAnnotationStripLayer を描画する方法を示しています。また、この例では、プロット内にカスタム オーバーレイ テキストを描画する方法を示します。詳細については、チャート オーバーレイ テキスト トピックを参照してください。
XAML の場合:
<ig:DataAnnotationStripLayer
StartValueMemberPath="Start"
EndValueMemberPath="End"
ItemsSource="{Binding}" />
C# の場合:
var xAxisBottom = new CategoryXAxis
{
    Label = "Date",
    DataSource = data,
    TickLength = 0,
    LabelLocation = AxisLabelsLocation.OutsideTop,
    LabelFontSize= 12,
    LabelMargin = new Padding(8, 3, 8, 5),
    LabelExtent = 40,
    LabelTextColor = Color.Transparent,
};
chart.Axes.Add(xAxisBottom);

chart.Series.Add(CreateStockMarketEvents(xAxisBottom));

public Series CreateStockMarketEvents(Axis targetAxis)
{
    var annoLayer = new DataAnnotationStripLayer();
    annoLayer.Brush = Brushes.Black;
    annoLayer.Outline = Brushes.Black;
    annoLayer.StartValueMemberPath = "Start";
    annoLayer.EndValueMemberPath = "End";
    annoLayer.TargetAxis = targetAxis;
    annoLayer.DataSource = new List<Annotation>
    {
        new Annotation() { Start = 40, End = 45, Label = "Covid - Market Crash" },
        new Annotation() { Start = 100, End = 144, Label = "Fed Rate Up  0.25 - 5.25%"  },
        new Annotation() { Start = 190, End = 205, Label = "Fed Rate Down 5.25% to 4.45%"  },
    };

    // setting optional properties
    annoLayer.StartLabelDisplayMode = DataAnnotationDisplayMode.Hidden;
    annoLayer.EndLabelDisplayMode = DataAnnotationDisplayMode.Hidden;
    annoLayer.EndLabelDisplayMode = DataAnnotationDisplayMode.Hidden;
    annoLayer.CenterLabelDisplayMode = DataAnnotationDisplayMode.DataLabel;
    annoLayer.CenterLabelMemberPath = "Label";

    return annoLayer;
}次のコード例は、軸注釈の背景、境界線の色、境界線の太さなどのスタイル プロパティをオーバーレイ テキストのスタイル プロパティとして設定して、DataAnnotationStripLayer をカスタマイズする方法を示しています。
C# の場合:
chart.Series.Add(StylingDataAnnotationStripLayer(xAxisBottom));

public Series StylingDataAnnotationStripLayer(Axis targetAxis)
{
    var annoLayer = new DataAnnotationStripLayer();
    // NOTE see setup properties in the first examples

    // styling start label of annotations
    annoLayer.StartLabelDisplayMode = DataAnnotationDisplayMode.AxisValue;
    annoLayer.StartLabelTextColor = Brushes.White;
    annoLayer.StartLabelBackground = Brushes.Orange;
    annoLayer.StartLabelBorderColor = Brushes.Black;
    annoLayer.StartLabelBorderThickness = 1;
    annoLayer.StartLabelBorderRadius = 4;
    annoLayer.StartLabelPadding = new Thickness(4);

    // styling end label of annotations
    annoLayer.EndLabelDisplayMode = DataAnnotationDisplayMode.AxisValue;
    annoLayer.EndLabelTextColor = Brushes.White;
    annoLayer.EndLabelBackground = Brushes.Orange;
    annoLayer.EndLabelBorderColor = Brushes.Black;
    annoLayer.EndLabelBorderThickness = 1;
    annoLayer.EndLabelBorderRadius = 4;
    annoLayer.EndLabelPadding = new Thickness(4);

    // styling center label of annotations
    annoLayer.AnnotationLabelDisplayMode = DataAnnotationDisplayMode.AxisValue;
    annoLayer.AnnotationTextColor = Brushes.White;
    annoLayer.AnnotationBackground = Brushes.Orange;
    annoLayer.AnnotationBorderColor = Brushes.Black;
    annoLayer.AnnotationBorderThickness = 1;
    annoLayer.AnnotationBorderRadius = 4;
    annoLayer.AnnotationPadding = new Thickness(4);

    // styling optional overlay text
    annoLayer.OverlayTextColor = Brushes.White;
    annoLayer.OverlayTextBackground = Brushes.Green;
    annoLayer.OverlayTextBorderColor = Brushes.Black;
    annoLayer.OverlayTextBorderThickness = 1;
    annoLayer.OverlayTextBorderRadius = 4;
    annoLayer.OverlayTextHorizontalMargin = 5;
    annoLayer.OverlayTextHorizontalPadding = 2;
    annoLayer.OverlayTextVerticalMargin = 5;
    annoLayer.OverlayTextVerticalPadding = 2;

    return annoLayer;
}次の表は、DataAnnotationStripLayer の最も重要なプロパティとその説明を示しています。