
Ultimate UI for WPF では、DataAnnotationLineLayer は、XamDataChart コンポーネントのプロット領域内の 2 つのポイント間に複数の線を描画します。このデータ注釈レイヤーを使用すると、株価の上昇と下落を株価チャートに注釈として表示できます。すべてのシリーズと同様に、DataAnnotationLineLayer も ItemsSource プロパティによるデータ バインディングをサポートしています。このプロパティは、線の開始ポイントと終了ポイントの x/y 座標を表す、少なくとも 4 つの数値データ列を持つデータ項目のコレクションを設定する必要があります。開始ポイントは StartValueXMemberPath および StartValueYMemberPath プロパティを使用してマップする必要があり、終了ポイントは EndValueXMemberPath および EndValueYMemberPath プロパティを使用してマップする必要があります。
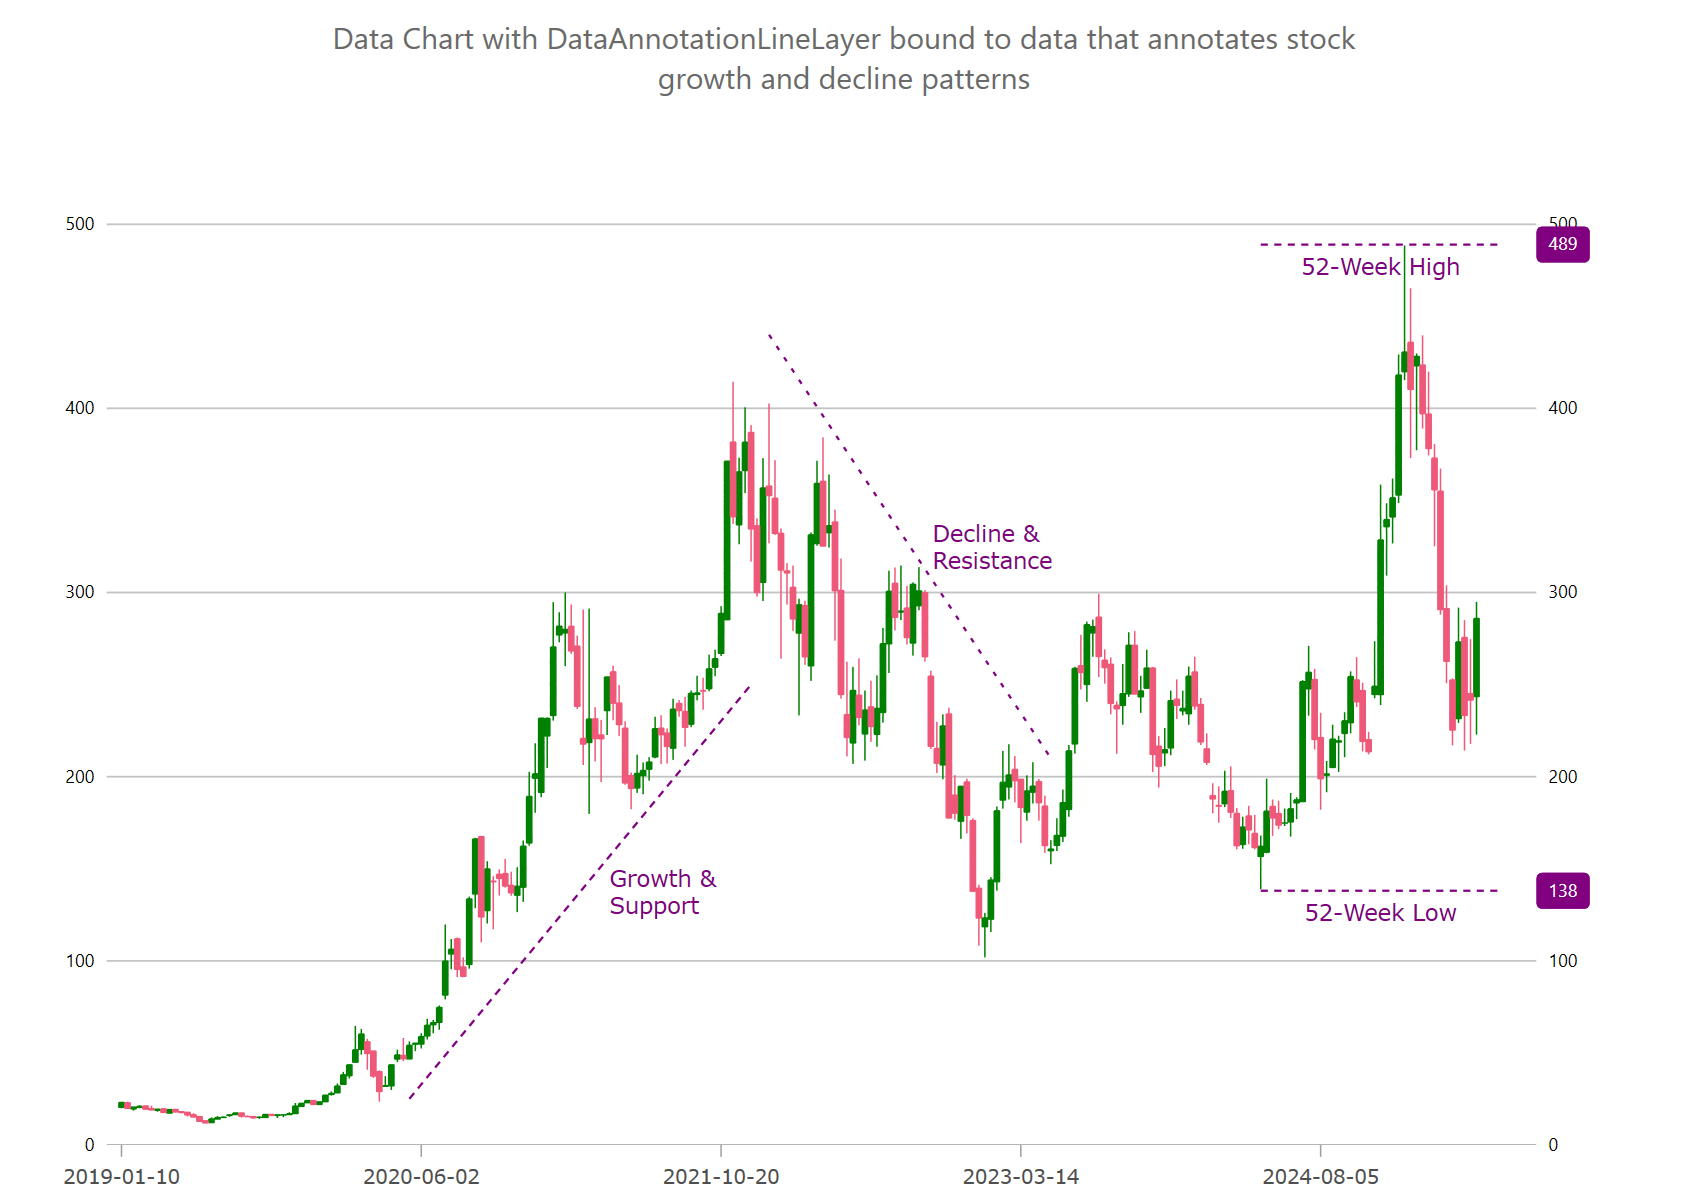
たとえば、DataAnnotationLineLayer を使用して、Y 軸に株価の増加と減少のパターン、および株価の 52 週間の高値と安値の注釈を付けることができます。
次のコード スニペットは、上の図に示すように、いくつかのライン注釈レイヤーを描画する方法を示しています。また、この例では、プロット内にカスタム オーバーレイ テキストを描画する方法を示します。詳細については、チャート オーバーレイ テキスト トピックを参照してください。
XAML の場合:
<ig:DataAnnotationLineLayer
StartValueXMemberPath="StartX"
StartValueYMemberPath="StartY"
EndValueXMemberPath="EndX"
EndValueYMemberPath="EndY"
ItemsSource="{Binding}" />
C# の場合:
var xAxis = new CategoryXAxis
{
    Label = "Date",
    DataSource = data,
    LabelMargin = new Padding(0, 15, 0, 15),
};

var yAxis = new NumericYAxis
{
    MinimumValue = 0,
    MaximumValue = 550,
    LabelLocation = AxisLabelsLocation.OutsideLeft,
    LabelFontSize = 12,
    LabelExtent = 80,
    LabelMargin = new Padding(8, 3, 8, 5)
};
chart.Axes.Add(xAxis);
chart.Axes.Add(yAxis);

chart.Series.Add(CreateStock52WeekRange(yAxis));
chart.Series.Add(CreateStockGrowthAndDecline(xAxis));

public static Series CreateStock52WeekRange(Axis targetAxis)
{
    var annoLayer = new DataAnnotationLineLayer();
    annoLayer.StartValueXMemberPath = "StartX";
    annoLayer.StartValueYMemberPath = "StartY";
    annoLayer.EndValueXMemberPath = "EndX";
    annoLayer.EndValueYMemberPath = "EndY";
    annoLayer.TargetAxis = targetAxis;
    annoLayer.DataSource = new List<Annotation>
    {
        new Annotation() {
            StartX = 190, StartY = 138,
            EndX = 230, EndY = 138,
            Label = "52-Week Low" },
        new Annotation() {
            StartX = 190, StartY = 481,
            EndX = 230, EndY = 481,
            Label = "52-Week High" },
    };

    // setting optional annotation properties
    annoLayer.Brush = Brushes.Purple;
    annoLayer.Outline = Brushes.Purple;
    annoLayer.AreaFillOpacity = 0.1;
    annoLayer.StartLabelXDisplayMode = DataAnnotationDisplayMode.Hidden;
    annoLayer.StartLabelYDisplayMode = DataAnnotationDisplayMode.DataValue;
    annoLayer.EndLabelXDisplayMode = DataAnnotationDisplayMode.Hidden;
    annoLayer.EndLabelYDisplayMode = DataAnnotationDisplayMode.DataValue;
    annoLayer.CenterLabelXDisplayMode = DataAnnotationDisplayMode.Hidden;

    // adding optional overlay text
    annoLayer.OverlayTextColor = Brushes.Purple;
    annoLayer.OverlayTextMemberPath = "Label";

    return annoLayer;
}

public static Series CreateStockGrowthAndDecline(Axis targetAxis)
{
    var annoLayer = new DataAnnotationLineLayer();
    annoLayer.StartValueXMemberPath = "StartX";
    annoLayer.StartValueYMemberPath = "StartY";
    annoLayer.EndValueXMemberPath = "EndX";
    annoLayer.EndValueYMemberPath = "EndY";
    annoLayer.TargetAxis = targetAxis;
    annoLayer.DataSource = new List<Annotation>
    {
        new Annotation() {
            StartX = 48, StartY = 25,
            EndX = 105, EndY = 250,
            Label = "Growth &\nSupport"
        },
        new Annotation() {
            StartX = 108, StartY = 440,
            EndX = 155, EndY = 210,
            Label = "Decline &\nResistance"
        },
    };

    // setting optional annotation properties
    annoLayer.StartLabelXDisplayMode = DataAnnotationDisplayMode.Hidden;
    annoLayer.EndLabelXDisplayMode = DataAnnotationDisplayMode.Hidden;
    annoLayer.CenterLabelXDisplayMode = DataAnnotationDisplayMode.Hidden;
    annoLayer.AnnotationBackgroundMode = AnnotationAppearanceMode.BrightnessShift;
    annoLayer.Brush = Brushes.Purple;

    // adding optional overlay text
    annoLayer.OverlayTextColor = Brushes.Purple;
    annoLayer.OverlayTextMemberPath = "Label";
    annoLayer.OverlayTextHorizontalMargin = 60;
    annoLayer.OverlayTextVerticalMargin = -10;

    return annoLayer;
}次のコード例は、軸注釈の背景、境界線の色、境界線の太さなどのスタイル プロパティをオーバーレイ テキストのスタイル プロパティとして設定して、DataAnnotationLineLayer をカスタマイズする方法を示しています。
C# の場合:
chart.Series.Add(StylingDataAnnotationLineLayer(xAxisBottom));

public Series StylingDataAnnotationLineLayer(Axis targetAxis)
{
    var annoLayer = new DataAnnotationLineLayer();
    // NOTE see setup properties in the first examples

    // styling the starting point of annotation
    annoLayer.StartLabelDisplayMode = DataAnnotationDisplayMode.AxisValue;
    annoLayer.StartLabelTextColor = Brushes.White;
    annoLayer.StartLabelBackground = Brushes.Orange;
    annoLayer.StartLabelBorderColor = Brushes.Black;
    annoLayer.StartLabelBorderThickness = 1;
    annoLayer.StartLabelBorderRadius = 4;
    annoLayer.StartLabelPadding = new Thickness(4);

    // styling the ending point of annotation
    annoLayer.EndLabelDisplayMode = DataAnnotationDisplayMode.AxisValue;
    annoLayer.EndLabelTextColor = Brushes.White;
    annoLayer.EndLabelBackground = Brushes.Red;
    annoLayer.EndLabelBorderColor = Brushes.Black;
    annoLayer.EndLabelBorderThickness = 1;
    annoLayer.EndLabelBorderRadius = 4;
    annoLayer.EndLabelPadding = new Thickness(4);

    // styling optional label at center of annotations
    annoLayer.CenterLabelDisplayMode = DataAnnotationDisplayMode.AxisValue;
    annoLayer.CenterTextColor = Brushes.White;
    annoLayer.CenterBackground = Brushes.Green;
    annoLayer.CenterBorderColor = Brushes.Black;
    annoLayer.CenterBorderThickness = 1;
    annoLayer.CenterBorderRadius = 4;
    annoLayer.CenterPadding = new Thickness(4);

    // styling optional overlay text
    annoLayer.OverlayTextColor = Brushes.White;
    annoLayer.OverlayTextBackground = Brushes.Green;
    annoLayer.OverlayTextBorderColor = Brushes.Black;
    annoLayer.OverlayTextBorderThickness = 1;
    annoLayer.OverlayTextBorderRadius = 4;
    annoLayer.OverlayTextHorizontalMargin = 5;
    annoLayer.OverlayTextHorizontalPadding = 2;
    annoLayer.OverlayTextVerticalMargin = 5;
    annoLayer.OverlayTextVerticalPadding = 2;
    return annoLayer;
}次の表は、DataAnnotationLineLayer の最も重要なプロパティとその説明を示しています。