
このトピックでは、Ultimate UI for WPF の値オーバーレイ、値レイヤー、およびチャート注釈レイヤーを使用して、XamDataChart コンポーネントにカスタム オーバーレイ テキストを表示する方法について説明します。これらの注釈やオーバーレイ レイヤーは、表示されているシリーズに関連する X 軸上の重要なイベント (例: 企業の四半期決算) や Y 軸上の重要な値 を注釈するためによく使用されますが、さらにオーバーレイ テキストを使用して補足的な注釈を加えることも可能です。
たとえば、DataAnnotationSliceLayer、ValueOverlay、ValueLayer を使用してオーバーレイ テキストを表示できます。
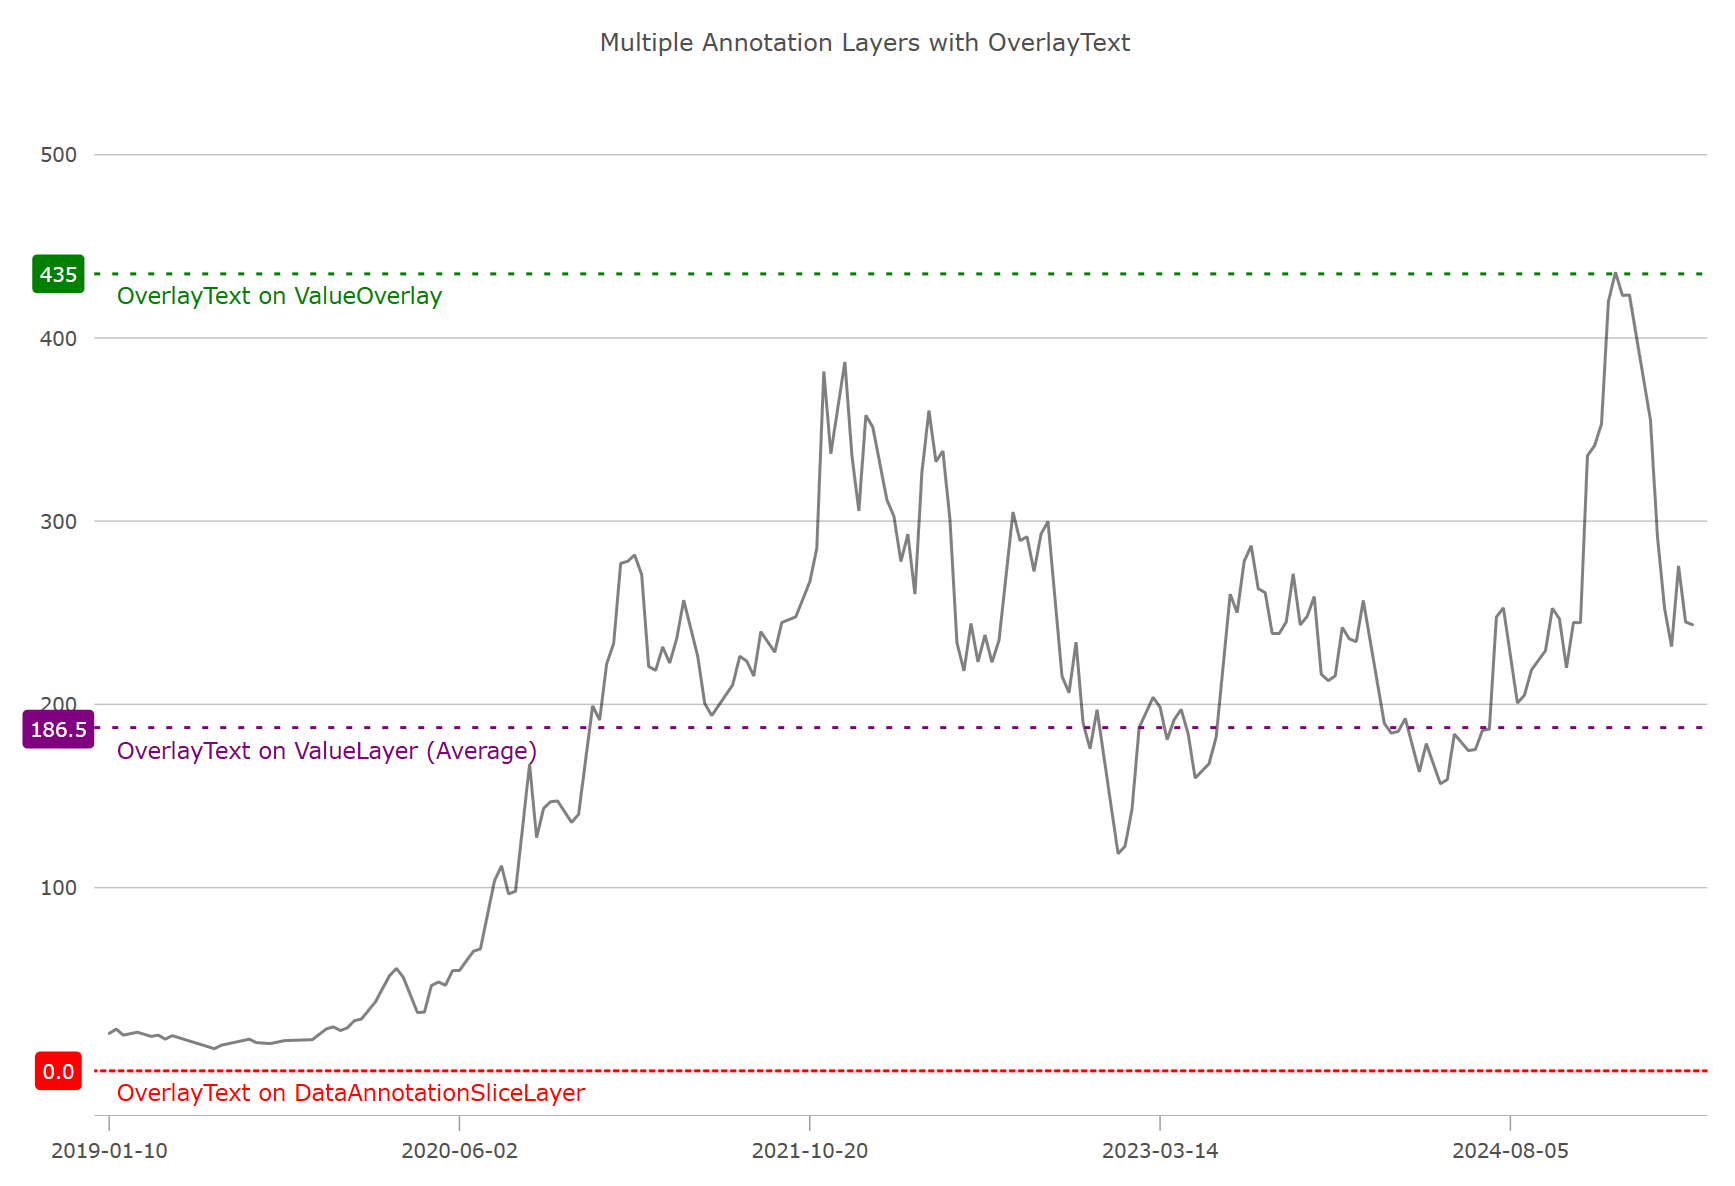
次のコード スニペットは、上の図に示すように、3 つの注釈レイヤーの比較を描画する方法を示しています。
XAML の場合:
<ig:DataAnnotationSliceLayer
AnnotationValueMemberPath="Value"
AnnotationLabelMemberPath="Label"
OverlayTextLocation="OutsideBottomLeft"
OverlayText="OverlayText on DataAnnotationSliceLayer"
TargetAxis="{Binding ElementName=yAxis}"
IsAxisAnnotationEnabled="true"
ItemsSource="{Binding}"
/>
C# の場合:
var yAxis = new NumericYAxis
{
    MinimumValue = 0,
    MaximumValue = 550,
    LabelExtent = 60,
    LabelMargin = new Padding(0, 0, 5, 0),
    LabelHorizontalAlignment = Portable.Components.UI.HorizontalAlignment.Center,
};

var sliceLayer = new DataAnnotationSliceLayer()
{
    DashArray = new DoubleCollection { 2, 4 },
    Brush = Brushes.Red,
    TargetMode = DataAnnotationTargetMode.NumericYAxes,
    Name = "AnnoLayer",
    Thickness = 2,
    OverlayText = "OverlayText on DataAnnotationSliceLayer",
    OverlayTextLocation = OverlayTextLocation.OutsideBottomLeft,
    AnnotationLabelMemberPath = "Label",
    AnnotationValueMemberPath = "Value",
    DataSource = new List<Annotation> { new Annotation() { Value = 0, } }
};

// Create the ValueOverlay
var valueOverlay = new ValueOverlay()
{
    Value = 435,
    Brush = Brushes.Green,
    IsAxisAnnotationEnabled = true,
    Thickness = 2,
    DashArray = new DoubleCollection { 2, 4 },
    Axis = yAxis,
    OverlayText = "OverlayText on ValueOverlay",
    OverlayTextLocation = OverlayTextLocation.OutsideBottomLeft
};

// Create the ValueLayer
var valueLayer = new ValueLayer()
{
    ValueMode = ValueLayerValueMode.Average,
    Brush = Brushes.Purple,
    Thickness = 2,
    DashArray = new DoubleCollection { 2, 4 },
    IsAxisAnnotationEnabled = true,
    OverlayText = "OverlayText on ValueLayer (Average)",
    OverlayTextLocation = OverlayTextLocation.OutsideBottomLeft
};

chart.Series.Add(valueOverlay);
chart.Series.Add(valueLayer);
chart.Axes.Add(xAxisBottom);
chart.Series.Add(sliceLayer);このコード例は、値オーバーレイ、値レイヤー、およびチャート注釈レイヤー上のオーバーレイ テキストのスタイルを設定およびカスタマイズする方法を示しています。
C# の場合:
public Series StylingOverlayText()
{
    var annoLayer = new DataAnnotationSliceLayer();

    // styling optional overlay text
    annoLayer.OverlayTextColor = Brushes.White;
    annoLayer.OverlayTextBackground = Brushes.Green;
    annoLayer.OverlayTextBorderColor = Brushes.Black;
    annoLayer.OverlayTextBorderThickness = 1;
    annoLayer.OverlayTextBorderRadius = 4;
    annoLayer.OverlayTextHorizontalMargin = 5;
    annoLayer.OverlayTextHorizontalPadding = 2;
    annoLayer.OverlayTextVerticalMargin = 5;
    annoLayer.OverlayTextVerticalPadding = 2;

    return annoLayer;
}