

Pie Chart コントロールの基本データに、小さい値を含む多くの項目が含まれる場合があります。この場合、Others カテゴリは、単一スライスへの複数のデータ値の自動集計を許可します。
以下は最終結果のプレビューです。
図 1: サンプル コードによって実装された Others カテゴリを備える円チャート
このトピックは、ユーザーが データ バインディングトピックを既に読んでいることを前提とし、開始点としてその中のコードを使用します。
データ モデルの定義。
円チャートの ItemSource として Data クラスのインスタンスを構成
Others カテゴリ の構成
(オプション) 結果の検証
データ モデルを定義 します。
DataItem と呼ばれるシンプルなデータ モデルを定義します。次に、相対的に小さい値の複数の DataItems を含む Data コレクションを定義します。
C# の場合:
    public class DataItem
    {
        public string Label { get; set; }
        public double Value { get; set; }
    }
    public class Data : ObservableCollection<DataItem>
    {
        public Data()
        {
            Add(new DataItem { Label = "Item 1", Value = 5 });
            Add(new DataItem { Label = "Item 2", Value = 6 });
            Add(new DataItem { Label = "Item 3", Value = 3 });
            Add(new DataItem { Label = "Item 4", Value = 7 });
            Add(new DataItem { Label = "Item 5", Value = 1 });
            Add(new DataItem { Label = "Item 6", Value = 1 });
            Add(new DataItem { Label = "Item 7", Value = 1 });
            Add(new DataItem { Label = "Item 8", Value = 1 });
            Add(new DataItem { Label = "Item 9", Value = 1 });
        }
    }
Visual Basic の場合:
Public Class DataItem
    Public Property Label() As String
        Get
            Return _Label
        End Get
        Set
            _Label = Value
        End Set
    End Property
    Private _Label As String
    Public Property Value() As Double
        Get
            Return _Value
        End Get
        Set
            _Value = Value
        End Set
    End Property
    Private _Value As Double
End Class
Public Class Data
    Inherits ObservableCollection(Of DataItem)
    Public Sub New()
        Add(New DataItem() With { .Label = "Item 1", .Value = 5  })
        Add(New DataItem() With { .Label = "Item 2", .Value = 6  })
        Add(New DataItem() With { .Label = "Item 3", .Value = 3  })
        Add(New DataItem() With { .Label = "Item 4", .Value = 7  })
        Add(New DataItem() With { .Label = "Item 5", .Value = 1  })
        Add(New DataItem() With { .Label = "Item 6", .Value = 1  })
        Add(New DataItem() With { .Label = "Item 7", .Value = 1  })
        Add(New DataItem() With { .Label = "Item 8", .Value = 1  })
        Add(New DataItem() With { .Label = "Item 9", .Value = 1  })
    End Sub
End Class
円チャートの ItemSource として Data クラスのインスタンスを構成します。
XAML の場合:
    <Grid x:Name="LayoutRoot" Background="White">
        <Grid.Resources>
            <local:Data x:Key="data" />
        </Grid.Resources>
        <ig:ItemLegend x:Name="Legend"
                       Grid.Row="1"
                       VerticalAlignment="Top"
                       HorizontalAlignment="Right" />
        <ig:XamPieChart Name="pieChart"
                        Grid.Row="2"
                        ItemsSource="{StaticResource data}"
                        LabelMemberPath="{}{Label}"
                        ValueMemberPath="Value"
                        LabelsPosition="BestFit"
                        Legend="{Binding ElementName=Legend}" />
    </Grid>
円チャートは図 2 として表示します。
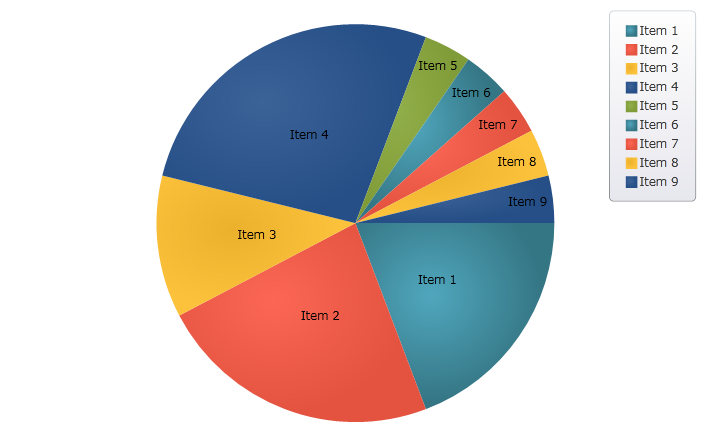
図 2: Others カテゴリを構成する前の円チャート
Others カテゴリを構成します。
項目の 5~9 は非常に小さく、雑然とした外観のチャートになります。XamPieChart の OthersCategoryThreshold、 OthersCategoryType、および OthersCategoryText プロパティを使用して、Others カテゴリにこれらの項目を割り当てます。
XAML の場合:
<ig:XamPieChart Name="pieChart"
                   OthersCategoryThreshold="2"
                   OthersCategoryType="Number"
                   OthersCategoryText="Others" />
OthersCategoryThreshold は 2 に設定、OthersCategoryType は Number に設定されています。したがって、2 以下の値を含む項目は、Others カテゴリに割り当てられます。
(オプション) 結果を確認します。
アプリケーションを実行します。上記の円チャートは図 1 として表示します。