
このトピックでは、UltraDataChart™ コントロールで ScatterPolygonSeries 要素を使用する方法を提供します。
UltraDataChart コントロールで、ScatterPolygonSeries は多角形を使用してデータを表示するビジュアル要素です。このシリーズのタイプは任意の図形を描画できます。ScatterPolygonSeries は、データがポリラインの代わりに多角形で描画されることを除いて、ScatterPolylineSeries とほどんど同様に機能します。
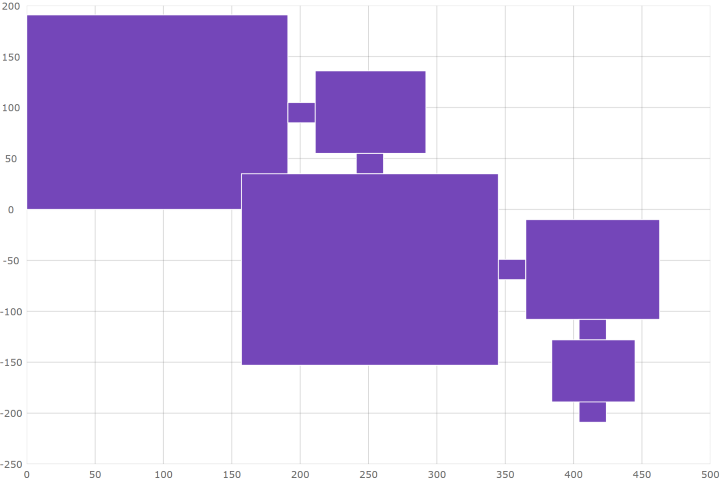
UltraDataChart コントロールのシリーズの他のタイプと同様、ScatterPolygonSeries には、データ バインディングのための DataSource プロパティがあります。このプロパティは、IEnumerable インターフェイスを実装するオブジェクトにバインドできます。さらに、このオブジェクトの各項目には、IEnumerable<IEnumerable<>> 構造を使用して図形のポイント位置(X と Y 値)を保存するデータ列が 1 つ必要です。このデータ列は、ShapeMemberPath プロパティにマップされます。ScatterPolygonSeries は、UltraDataChart コントロールで多角形をプロットするために、このマップされたデータ列のポイントを使用します。
以上のスクリーンショットでのデータの構造は以下です。
C# の場合:
public class Node
{
    // A list of polygons and each polygon has a list of points.
    public List<List<Point>> Points { get; set; }
}
Visual Basic の場合:
Public Class Node
    ' A list of polygons and each polygon has a list of points.
    Private _points As List(Of List(Of Point))
    public Property List(Of List(Of Point)) Points
        Get
            Return _points
        End Get
        Set
            _points = value
        End Set
    End Property
End Class
以下のコードは ScatterPolygonSeries をデータにバインドします。
Visual Basic の場合:
' ScatterPolygonSeries requires numeric X and Y axis
Dim xAxis = New NumericXAxis()
Dim yAxis = New NumericYAxis()
Me.dataChart.Axes.Add(xAxis)
Me.dataChart.Axes.Add(yAxis)

' create and set data binding to the ScatterPolygonSeries
Dim polygonSeries = New ScatterPolygonSeries()
polygonSeries.DataSource = Nodes
polygonSeries.ShapeMemberPath = "Points"
polygonSeries.XAxis = xAxis
polygonSeries.YAxis = yAxis

' add the ScatterPolygonSeries to the the UltraDataChart
Me.dataChart.Series.Add(polygonSeries)
C# の場合:
// ScatterPolygonSeries requires numeric X and Y axis
var xAxis = new NumericXAxis();
var yAxis = new NumericYAxis();
this.dataChart.Axes.Add(xAxis);
this.dataChart.Axes.Add(yAxis);

// create and set data binding to the ScatterPolygonSeries
var polygonSeries = new ScatterPolygonSeries();
polygonSeries.DataSource = Nodes;
polygonSeries.ShapeMemberPath = "Points";
polygonSeries.XAxis = xAxis;
polygonSeries.YAxis = yAxis;

// add the ScatterPolygonSeries to the the UltraDataChart
this.dataChart.Series.Add(polygonSeries);このトピックに関連する追加情報については、以下のトピックを参照してください。