this.UltraCategoryChart.IncludedProperties = new string[] { "ID", "Name", "Department" };
this.UltraCategoryChart.ExcludedProperties = new string[] { "Age" };
このトピックは、フラットと階層データを UltraCategoryChart コントロールにバインドする方法を説明します。各セクションの最後で、サンプルの全コードを提供します。
このトピックは、以下のセクションで構成されます。
以下の手順は、UltraCategoryChart コントロールをデータ コレクションにバインドする方法を示します。 UltraCategoryChart は、IEnumerable インターフェイスを実装する任意のオブジェクトにバインドすることができます。ICollection および IEnumerable を実装するネスト コレクションがサポートされます。
このトピックでは、2 つのデータ コレクション (フラットおよび階層) を定義後、カテゴリ チャート コントロールをアプリケーションに追加し、そのコントロールの ItemsSource を指定データ コレクションのインスタンスにバインドします。
データ モデルに関連する特定のプロパティがチャートごとにシリーズとしてプロットする必要があるかどうかを明示的に定義する必要があります。 2 つのオプションがあり、プロパティをタグ付けして UltraCategoryChart に含むか除外できます。
Include および Exclude プロパティの設定
各プロパティは、データモデルで定義されたプロパティ名に対応する文字列の配列に等しい必要があります。
C# の場合:
this.UltraCategoryChart.IncludedProperties = new string[] { "ID", "Name", "Department" };
this.UltraCategoryChart.ExcludedProperties = new string[] { "Age" };
Visual Basic の場合:
Me.UltraCategoryChart.IncludedProperties = New String(){"ID", "Name", "Department"}
Me.UltraCategoryChart.ExcludedProperties = New String(){ "Age" };
プロパティの属性
DataSeriesMemberIntent 属性をプロパティに割り当てて明示的に状態を定義します。以下のコード スニペットは、プロパティの省略、名前付き Department が UltraCategoryChart でプロットされるシリーズを示します。
C# の場合:
[DataSeriesMemberIntent(DataSeriesIntent.DontPlot)]
public string Department
{
   get { return m_Department; }
   set { m_Department = value; }
}
Visual Basic の場合:
<DataSeriesMemberIntent(DataSeriesIntent.DontPlot)> _
Public Property Department() As String
	Get
		Return m_Department
	End Get
	Set
		m_Department = value
	End Set
End Property以下は、UltraCategoryChart コントロールを追加するための一般要件です。
以下の名前空間の参照を追加します。
C# の場合:
using Infragistics.Win.DataVisualization;Visual Basic の場合:
Imports Infragistics.Win.DataVisualization数値フィールド
チャートにバインドしたコレクションに含まれる各数値プロパティは、データシリーズ値として翻訳され、項目とシリーズ ラベルとしてその名前を参照します。データ モデルで定義した数値プロパティがない場合、チャートは正しく動作しません。 階層構造のデータソースがサポートされるため、コントロールまたは XAML コードを変更せずに複数シリーズを表示できます。
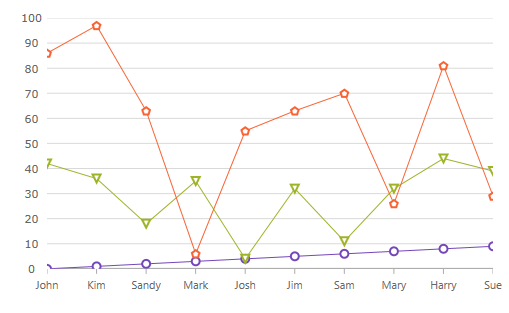
UltraCategoryChart コントロールは、フラットデータサンプルコードによって実装されます。
図 1

データ モデルの定義
UltraCategoryChart コントロールのインスタンスの追加
(オプション) 結果の検証
データ モデルの定義
データをモデル化するためのクラスを作成します。以下のコードは、シンプルな値とラベルのペアを表す DataItem クラス、およびそれらのペアのコレクションを表す Data クラスを作成します。
C# の場合:
  public class ViewModel
    {
        public ObservableCollection<DataItem> Data { get; set; }

        public ViewModel()
        {
            CreateData();
        }

		private string[] names = { "John", "Kim", "Sandy", "Mark", "Josh", "Jim", "Sam", "Mary", "Harry", "Sue", "Chris", "Joe", "Carl" };
        private void CreateData()
        {
            Random r = new Random();

            for (int j = 0; j <= 2; j++)
            {
                Data = new ObservableCollection<DataItem>();

                for (int i = 0; i <= 9; i++)
                {
                    Data.Add(new DataItem
                    {
                        ID = i,
                        Name = names[i],
                        Value1 = r.Next(1, 50),
                        Value2 = r.Next(1, 100)
                    });
                }
            }
        }
    }

    public class DataItem
    {
        public int ID { get; set; }
        public string Name { get; set; }
        public double Value1 { get; set; }
        public double Value2 { get; set; }
    }
Visual Basic の場合:
Public Class ViewModel
    Public Property Data() As ObservableCollection(Of DataItem)
        Get
            Return m_Data
        End Get
        Set(value As ObservableCollection(Of DataItem))
            m_Data = Value
        End Set
    End Property
    Private m_Data As ObservableCollection(Of DataItem)

    Public Sub New()
        CreateData()
    End Sub

    Private names As String() = {"John", "Kim", "Sandy", "Mark", "Josh", "Jim", _
        "Sam", "Mary", "Harry", "Sue", "Chris", "Joe", _
        "Carl"}
    Private Sub CreateData()
        Dim r As New Random()

        For j As Integer = 0 To 2
            Data = New ObservableCollection(Of DataItem)()
            For i As Integer = 0 To 9

                Data.Add(New DataItem() With {
                     .ID = i,
                     .Name = names(i),
                     .Value1 = r.[Next](1, 50),
                     .Value2 = r.[Next](1, 100)
                })
            Next
        Next
    End Sub
End Class


Public Class DataItem

    Public Property ID() As Integer
        Get
            Return m_ID
        End Get
        Set(value As Integer)
            m_ID = value
        End Set
    End Property
    Private m_ID As Integer

    Public Property Name() As String
        Get
            Return m_Name
        End Get
        Set(value As String)
            m_Name = value
        End Set
    End Property
    Private m_Name As String

    Public Property Value1() As Double
        Get
            Return m_Value1
        End Get
        Set(value As Double)
            m_Value1 = value
        End Set
    End Property
    Private m_Value1 As Double

    Public Property Value2() As Double
        Get
            Return m_Value2
        End Get
        Set(value As Double)
            m_Value2 = value
        End Set
    End Property
    Private m_Value2 As Double

End Class
UltraCategoryChart コントロールのインスタンスを追加
レイアウト ルートにデータ コレクションのインスタンス、凡例インスタンス、および UltraCategoryChart のインスタンスを追加します:
結果の確認 (オプション)
結果を検証するために、アプリケーションを実行します。UltraCategoryChart コントロールのデータ コレクションへのバインドが成功すれば、結果のチャートは上記の図 1 に示すようなものになります。
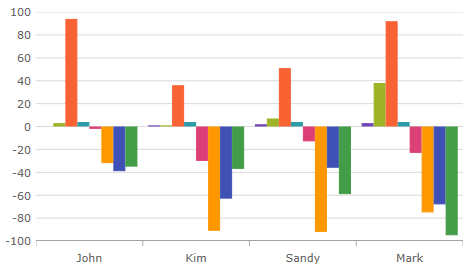
図 2

UltraCategoryChart コントロールは、ネスト サンプルコードによって実装されます。正の値は親データ項目のプロパティを表します。負の値は子プロパティの値を示します。
ネスト データ モデルの定義
UltraCategoryChart コントロールのインスタンスの追加
(オプション) 結果の検証
データ モデルの定義
データをモデル化するためのクラスを作成します。以下のコードは、ネスト レベル コレクションを表す Parent および Child クラス、同様にペアのコレクションを表す ViewModel を作成します。
前提条件:
子レベル クラスは数値プロパティを含みます。
View Model は、親レベル コレクションと等しいタイプの ObservableCollection を実装する必要があります。これによって子オブジェクトを追加できます。
親クラスは IEnumerable を実装する必要があります。
C# の場合:
    public class ViewModel : ObservableCollection<Parent>
    {
        public ViewModel()
        {
            CreateData();
        }

        private string[] names = {"John","Kim","Sandy","Mark","Josh","Jim","Sam"};

 private void CreateData()
        {
            Random r = new Random();

            for (int j = 0; j <= 3; j++)
            {
                Parent dt = new Parent()
                {
                        ID = j,
                        Name = names[j],
                        Value1 = r.Next(1, 50),
                        Value2 = r.Next(1, 100),
                        Children = new ObservableCollection<Child>()
                };

                    for (int y = 0; y <= 3; y++)
                    {
                        Child children = new Child()
                        {
                            ID = y + 1,
                            Name = names[y],
                            Value2 = r.Next(-100, 0),
                            };

                            dt.Children.Add(children);
                     }
                   this.Add(dt);
            }
        }
    }

    public class Parent : IEnumerable
    {
		public ObservableCollection<Child> Children { get; set; }
		public double ID { get; set; }
		public string Name { get; set; }
		public double Value1 { get; set; }
		public double Value2 { get; set; }

        public IEnumerator GetEnumerator()
        {
            return this.Children.GetEnumerator();
        }
    }

    public class Child
    {
    	 public double ID { get; set; }
        public string Name { get; set; }
        public double Value2 { get; set; }
    }
Visual Basic の場合:
Public Class ViewModel
Inherits ObservableCollection(Of Parent)
    Public Sub New()
        CreateData()
    End Sub

    Private names As String() = {"John", "Kim", "Sandy", "Mark", "Josh", "Jim", "Sam"}
    Private Sub CreateData()
        Dim r As New Random()

        For j As Integer = 0 To 3 Step 1

     Dim dt As New Parent With
     {
              .ID = j,
              .Name = names(j),
              .Value1 = r.[Next](1, 50),
              .Value2 = r.[Next](1, 100),
  		.Children = New ObservableCollection(Of Child)()
            }

     For y As Integer = 0 To 3 Step 1

                Dim children As New Child() With
                {
                    .ID = y,
                    .Name = names(y),
                    .Value2 = r.[Next](-100, 0)
                }
		  dt.Children.Add(children)

            Next

     Me.Add(dt)

        Next
    End Sub
End Class


Public Class Parent
Implements IEnumerable
Public Property Children() As ObservableCollection(Of Child)
        Get
            Return m_Children
        End Get
        Set(value As Integer)
            m_Children = value
        End Set
    End Property
    Public Property ID() As Integer
        Get
            Return m_ID
        End Get
        Set(value As Integer)
            m_ID = value
        End Set
    End Property
    Private m_ID As Integer
    Public Property Name() As String
        Get
            Return m_Name
        End Get
        Set(value As String)
            m_Name = value
        End Set
    End Property
    Private m_Name As String
    Public Property Value1() As Double
        Get
            Return m_Value1
        End Get
        Set(value As Double)
            m_Value1 = value
        End Set
    End Property
    Private m_Value1 As Double
    Public Property Value2() As Double
        Get
            Return m_Value2
        End Get
        Set(value As Double)
            m_Value2 = value
        End Set
    End Property

    Private m_Value2 As Double

    Public Function GetEnumerator() As IEnumerator Implements IEnumerable.GetEnumerator
        Return DirectCast(Children, ICollection).GetEnumerator()
    End Function
End Class

Public Class Child
    Public Property ID() As Double
        Get
            Return m_ID
        End Get
        Set(value As Double)
            m_ID = value
        End Set
    End Property
    Private m_ID As Double

    Public Property Name() As String
        Get
            Return m_Name
        End Get
        Set(value As String)
            m_Name = value
        End Set
    End Property
    Private m_Name As String

    Public Property Value1() As Double
        Get
            Return m_Value1
        End Get
        Set(value As Double)
            m_Value1 = value
        End Set
    End Property
    Private m_Value1 As Double

    Public Property Value2() As Double
        Get
            Return m_Value2
        End Get
        Set(value As Double)
            m_Value2 = value
        End Set
    End Property

    Private m_Value2 As Double


End Class
UltraCategoryChart コントロールのインスタンスを追加
レイアウト ルートにネスト データ コレクションのインスタンスおよびカテゴリ チャートのインスタンスを追加します:
結果の確認 (オプション)
結果を検証するために、アプリケーションを実行します。カテゴリ チャート コントロールにデータ コレクションをバインドすると、チャートは上記の図 2 のようになります。
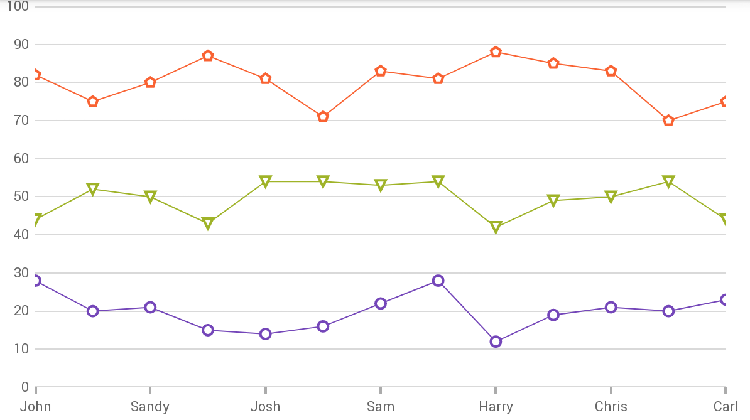
図 3
コレクションのコレクション データ ソースと実装される UltraCategoryChart。

データ モデルの定義。
UltraCategoryChart コントロールのインスタンスを追加します。
(オプション) 結果を検証します。
データ モデルの定義
データをモデル化するためのクラスを作成します。以下のコードは、IList<IList<Type>> 形式のネストされるコレクションを持つ ViewModel クラスを作成し、上記の階層データ構造のように生成します。
C# の場合:
public class ViewModel
{
    public ObservableCollection<ObservableCollection<SampleData>> Data { get; set; }

    private string[] names = { "John", "Kim", "Sandy", "Mark", "Josh", "Jim", "Sam", "Mary", "Harry", "Sue", "Chris", "Joe", "Carl" };

    Random r = new Random();
    public ViewModel()
    {
        Data = new ObservableCollection<ObservableCollection<SampleData>>();

        for(int i=0; i<3; i++)
        {
            ObservableCollection<SampleData> innerData = new ObservableCollection<SampleData>();
            for(int j = 0; j <names.Length; j++)
            {
                SampleData sd = new SampleData() { Name = names[j] };

                if(i == 0)
                {
                    sd.Value = r.Next(10, 30);
                }
                else if(i == 1)
                {
                    sd.Value = r.Next(40, 60);
                }
                else
                {
                    sd.Value = r.Next(70, 90);
                }

                innerData.Add(sd);
            }
            Data.Add(innerData);
        }
    }
}

public class SampleData
{
    public string Name { get; set; }
    public int Value { get; set; }
}
Visual Basic の場合:
Public Class ViewModel
    Public Property Data() As ObservableCollection(Of ObservableCollection(Of SampleData))
        Get
            Return m_Data
        End Get
        Set
            m_Data = Value
        End Set
    End Property
    Private m_Data As ObservableCollection(Of ObservableCollection(Of SampleData))

    Private names As String() = {"John", "Kim", "Sandy", "Mark", "Josh", "Jim",
        "Sam", "Mary", "Harry", "Sue", "Chris", "Joe", "Carl"}

    Private r As New Random()
    Public Sub New()
        Data = New ObservableCollection(Of ObservableCollection(Of SampleData))()

        For i As Integer = 0 To 2
            Dim innerData As New ObservableCollection(Of SampleData)()
            For j As Integer = 0 To names.Length - 1
                Dim sd As New SampleData() With {
                    .Name = names(j)
                }

                If i = 0 Then
                    sd.Value = r.[Next](10, 30)
                ElseIf i = 1 Then
                    sd.Value = r.[Next](40, 60)
                Else
                    sd.Value = r.[Next](70, 90)
                End If

                innerData.Add(sd)
            Next

            Data.Add(innerData)
        Next
    End Sub
End Class

Public Class SampleData
    Public Property Name() As String
        Get
            Return m_Name
        End Get
        Set
            m_Name = Value
        End Set
    End Property
    Private m_Name As String
    Public Property Value() As Integer
        Get
            Return m_Value
        End Get
        Set
            m_Value = Value
        End Set
    End Property
    Private m_Value As Integer
End Class
UltraCategoryChart コントロールのインスタンスを追加します。
UltraCategoryChart のインスタンスをレイアウト ルートに追加し、それを IList<IList<Type>> にバインドします。
結果の確認 (オプション)
結果を検証するために、アプリケーションを実行します。UltraCategoryChart に IList<IList<Type>> をバインドすると、チャートは上記の図 3 のようになります。
このトピックの追加情報については、以下のトピックも合わせてご参照ください。