

Infragistics Blog

Next Generation Charting & Data Analysis: Chart Toolbar & More
The Chart Toolbar, introduced in 23.1 as a Preview component, is a companion container for UI actions that may be used independently or in conjunction with the Data Chart and Category Chart components. This allows you to simply select from a predefined set of properties on the chart to perform deeper data analysis on the data displayed in the chart.

What Are The Top 4 Angular Grid Data Manipulation Features?
One of the main purposes of any Grid component is to work with data. But what are the top Angular Grid Data Manipulation features you must use? Learn here.
5 Must-Have Angular Grid Row Features & How To Use Them
What are the must-have Angular Grid Row features to consider when working on your next project? In this article, we talk about the top 5. Find out more.
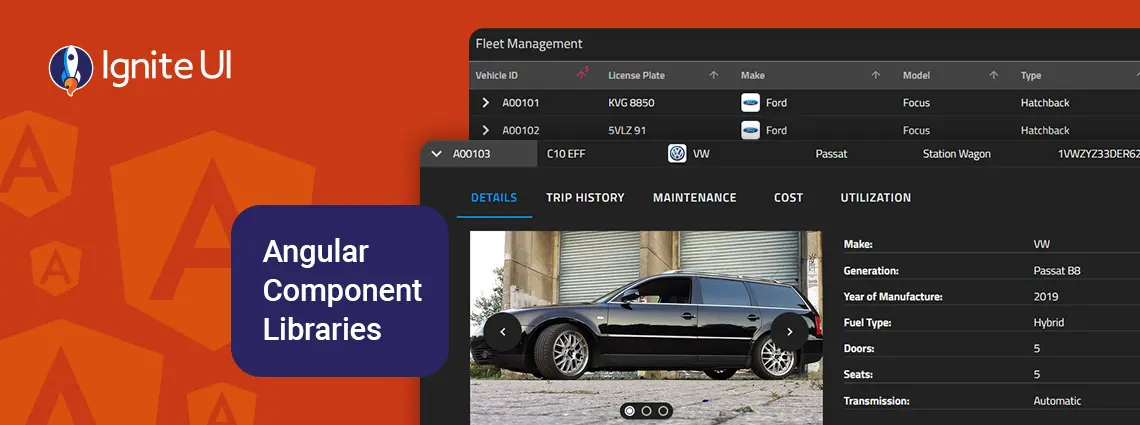
The Best 12 Angular Component Libraries Today
With so many Angular libraries available on the market today, how do you choose the best one? Read our list of the best 9 Angular component libraries today.

Ignite UI for Angular 16.0.0: See The Exciting Improvements
We are shipping the new Ignite UI for Angular 16.0.0 release today with full support for Angular v16! See the latest updates and start building better apps.

5 Must-Have Angular Grid Column-Based Features
This article explores 5 Angular grid column-based features that will let you customize different elements with ease. Learn more and try them.

Ignite UI Dock Manager: For Web Layouts & Better Usability
See how easy it is to build multi-window, multi-screen apps in any framework with Infragistics' new Dock Manager in Angular, Blazor, React, and Web Components. Try it now!

The Top 5 Angular Data Grid Features You Never Knew You Needed
This article focuses on the top 5 Angular Data Grid features that are less known but are mandatory and extremely useful in modern grids. Find out more.

How To Choose the Best Angular Data Visualization Library
This quick guide will show you what an effective data visualization looks like and will help you choose the most powerful Angular Data Visualization library for your project. Key factors included. Read all.