var DataChart = new XamDataChart();
var xAxis = new CategoryXAxis()
{
ItemsSource = data,
Label = "Date"
};
var yAxis1 = new NumericYAxis()
{
LabelLocation = AxisLabelsLocation.OutsideLeft
};
var yAxis2 = new NumericYAxis()
{
LabelLocation = AxisLabelsLocation.OutsideRight
};
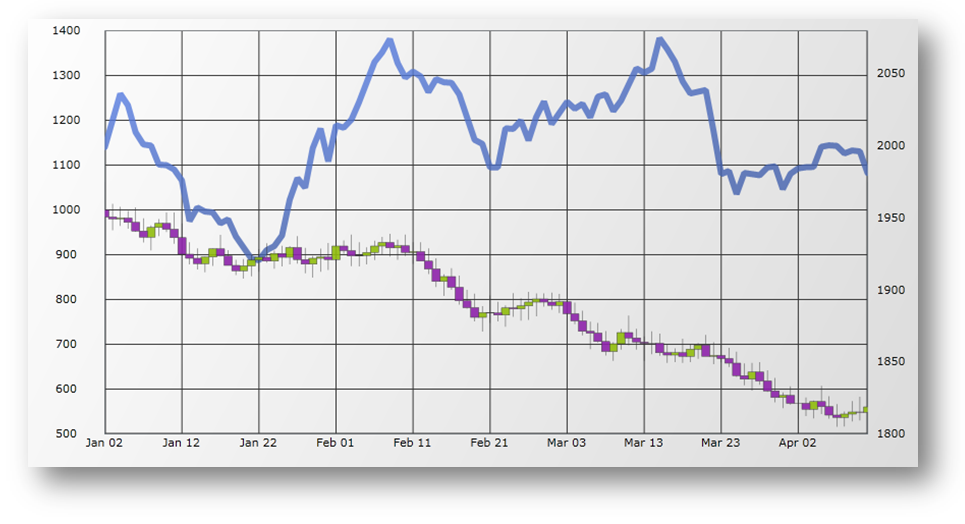
var series1 = new LineSeries()
{
XAxis = xAxis,
YAxis = yAxis2,
ItemsSource = data,
ValueMemberPath = "Volume"
};
var series2 = new FinancialPriceSeries()
{
XAxis = xAxis,
YAxis = yAxis1,
ItemsSource = data,
CloseMemberPath = "Close",
OpenMemberPath = "Open",
HighMemberPath = "High",
LowMemberPath = "Low"
};
DataChart.Axes.Add(yAxis1);
DataChart.Axes.Add(yAxis2);
DataChart.Axes.Add(xAxis);
DataChart.Series.Add(series1);
DataChart.Series.Add(series2);